At a time when data modelling became a necessity, there were no standard ways of modelling databases even though many ways were proposed but none were widely adopted. This led Peter Pin-Shan Chen to come up with the ER model which focused on entities and the relationships that existed between these entities and also a way to diagrammatical represent the entity-relationships through ER diagrams.
What Is An ER Diagram?
It is a visual representation of entities in a system and the relationships these entities use to interact or associate. Although ERDs (ER Diagrams) can be used to model almost any system they are primarily used in database design and software engineering during the planning stages of the software project because they help to identify different system elements and their relationships with each other.
ER Diagram Notation and Symbols
An ERD has three basic elements: entity, attribute and relationships though they are a few more elements based on these basic ones. They are weak entity, multi-valued attribute, derived attribute, weak relationship, and recursive relationship. Now let's look at each of these elements in brevity and how they are represented in an ERD.
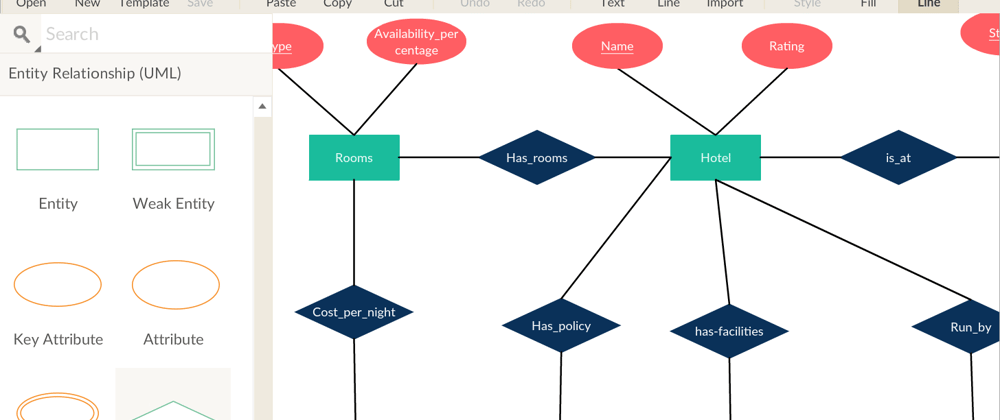
An entity refers to a real-world object like a person, a place or an event that is of importance to a give system. They are represented in ER diagrams by a rectangle and named using singular nouns.
A weak entity is an entity that depends on the existence of another entity. In more technical terms, it is as an entity that cannot be identified by its own attributes. They are depicted by double rectangles. In the diagram below Order item is the weak entity because it's existence solely depends on whether or not there is an order.

- An attribute is a property, trait, or characteristic of an entity, a relationship, or another attribute. Attributes that have their own specific attributes are called composite attributes. For instance a house address has a house number, a street and a city attribute. Attributes are represented by eclipses(oval shapes).

- Multi-valued attributes are attributes with more than one value. Note that they are different from composite attributes. They are depicted by doubled eclipses. An example of a multi-valued attribute is a student entity in a school database with a telephone number attribute that has two different values (i.e two phone numbers).

- A Derived attribute is an attribute gotten from or based on another attribute. They are represented by dashed eclipses. An example of a derived attribute is the age of a student in a school database which can be derived from the birth date of that student.

- A relationship describes how entities interact. For example, the entity “Carpenter” may be related to the entity “table” by the relationship “builds” or “makes”. Relationships are represented by diamond shapes and are labeled using verbs.

- A recursive (unary) relationship is made up of only one entity. (i.e the same entity participates more than once in a relationship). For example a in a company database, a supervisee is an employee and the supervisor can be an employee as well so the relationship is a recursive one.

Now lets talk about how to draw ERDs and some best practices if I may.
How to Draw ER Diagrams
- Identify all the entities in the system. An entity should appear only once in a particular ER diagram. Create rectangles for all entities and name them properly.
- Identify relationships between entities. Connect them using a line and add a diamond in the middle describing the relationship.
- Add attributes for entities. Give meaningful attribute names so they can be easily understood.
Sounds simple right? In a complex system, it can be a nightmare to identify relationships. This is a skill you’ll perfect only with deliberate practice.
Now some best practices to follow when drawing ER diagrams.
- Provide a precise and appropriate name for each entity, attribute, and relationship in the diagram. Names that are simple and familiar always beats vague, technical-sounding words. In naming entities, remember to use singular nouns. However, adjectives may be used to distinguish entities belonging to the same class (part-time employee and full-time employee, for example). Meanwhile attribute names must be meaningful, unique, system-independent, and easily understandable.
- Remove vague, redundant or unnecessary relationships between entities.
- Never connect a relationship to another relationship.
- Make effective use of colors. You can use colors to classify similar entities or to highlight key areas in your diagram.
PS😄 You can draw ER diagrams manually, especially when you are just informally showing simple systems to your friends or colleagues. However, for more complex systems and for external audiences, you need diagramming software such as Creately to draw visually engaging and precise ER diagrams.
Thanks you for reading my post and I hope it helps you understand and draw ER diagrams better. Connect with me on LinkedIn at Damue Brandon.


Top comments (2)
This is a very great article, well explained. Thanks for sharing,
I also wrote a piece about this:
masteringbackend.com/posts/getting...
I'm glad you liked it Solomon