Originally published on Failure is Inevitable.
In recent polls we’ve conducted with engineers and leaders, we’ve found that around 70% of participants used MTTA and MTTR as one of their main metrics. 20% of participants cited looking at planned versus unplanned work, and 10% said they currently look at no metrics. While MTTA and MTTR are good starting points, they're no longer enough. With the rise in complexity, it can be difficult to gain insights into your services’ operational health.
In this blog post, we’ll walk you through holistic measures and best practices that you can employ starting today. These will include challenges and pain points in gaining insight as well as key metrics and how they evolve as organizations mature.
Pain points for creating useful metrics
It’s easy to fall into the trap of being data rich but information poor. Building metrics and dashboards with the right context is crucial to understanding operational health, but where do you start? It’s important to look at roadblocks to adoption thus far in your organization. Perhaps other teams (or even your team) have looked into the way you measure success before. What halted their progress? If metrics haven’t undergone any change recently, why is that?
Below are some of the top customer pain points and challenges that we typically see software and infrastructure teams encounter.
- Lack of data: Your data is fragmented across your APM, ticketing, chatops, and other tools. Even worse, it's typically also siloed across teams that run at different speeds. A lot of it is tribal knowledge, or it simply doesn't exist.
- No feedback loop: There's limited to no integration between incidents, retrospectives, follow-up action items, planned work, and the customer experience. It’s challenging to understand how it all ties together as well as pinpoint how to actually improve customer experience. You’re constantly being redirected by unplanned work and incidents.
- Blank slate: Traditional APM and analytics tools are really great for insights, but without a baseline of metrics that are prescriptive and based on operational best practices, it's hard to know where to start.
- One-size-fits-all: What works for one team won't necessarily work for another. Everything needs to be put in the right context in order to provide insights that are truly relevant.
With these pain points in mind, let’s look at some key metrics other organizations we’ve spoken to have found success with.
Key metrics for operational health
For all metrics, the incentives across cross-functional software teams, development, operations, and product all need to be aligned. Metrics aren't there to crack the whip; they're simply a tool to help with planning. We like to think of them as the compass to help teams go down the right maturity path. If they're not being met, there should be an effort to understand why without blame. It’s highly likely that they're not being set in an achievable manner. It takes everyone on board in order to achieve a deeper understanding.
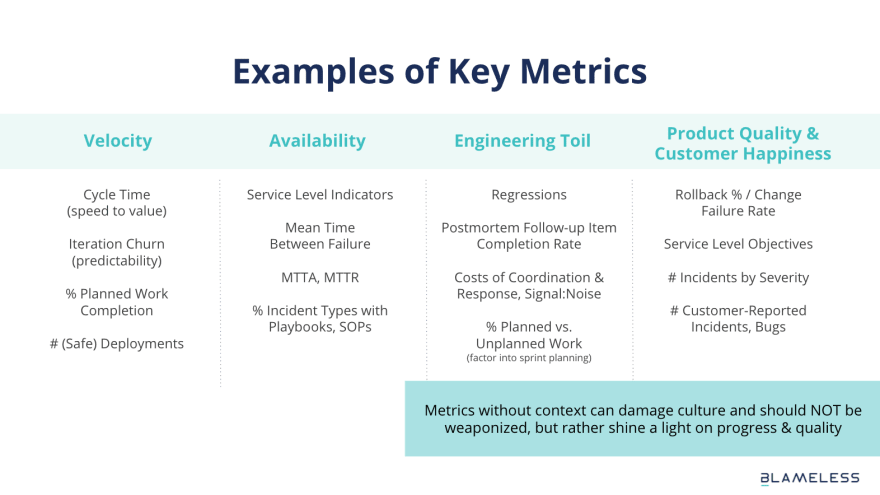
When we look at the metrics, we want to make sure that we have the right context, as metrics without context can lead to the wrong behaviors (such as fear-based management). We are not measuring just for measuring, and we don't need all the metrics in the world. We need to choose those metrics that help us get closer to doing what’s best for customers and the team.
Here are some common metrics that, with the right context, we’ve seen organizations have success with:
- Velocity: Arguably one of the most frequently used dimensions of measurement. Key measures include sprint capacity planning and how quickly the team pushes new features to production.
- Availability: The probability that a system is operational at a given time. Key measures include understanding the system and team’s ability to recover from incidents and interrupt work
- Engineering Toil: How much of the team’s time is spent on thrash, how much operational inefficiency is there in the system. Key measures include reduction of automation and cognitive overhead.
- Product Quality & Customer Happiness: Understanding customer happiness level. Key measures include understanding the status of key user journeys (SLOs), reactive incident response, and more.
 Each of these metrics on their own are not likely to be indicative of operational heath. For example, teams with higher deploy rates might seem more successful than teams with lower deploy rates. However, if the team with higher deploy rates also has a higher rate of failures or regressions, it’s no longer clear which team is the most successful.
Teams will need to figure out the context relevant to each metric. This might take time. After all, each team and organization will be at a different level of the metrics maturity model.
Metrics maturity model

Based on our customer interviews, we’ve mapped out the above maturity model which depicts how metrics evolve with ops maturity, ranging from fragile to leaders in the space. We’ve outlined some key characteristics of each.
- Fragile: This level of maturity is where many organizations find themselves. It’s reactive and stressful. At this stage, teams are likely measuring one thing: the number of incidents or customer tickets. This is a context-less stage where only the number is relevant. A quarter with 53 incidents may be seen as less successful than a quarter with 45 incidents, even if the 53 incidents were quick fixes that caused little customer impact. Or perhaps many of the incidents are labeled as either Sev0 or Sev1, either because teams aren’t sure how to classify incidents properly, or because each incident is really that dire. As a result, the majority of the time is spent on unplanned work.
- Unified: At this level, teams are likely sorting incidents by types and tags, gaining some insight into problem areas that had previously gone undiscovered. With this increased visibility, incidents will likely be spread between severe and less severe due to improved incident classification and mitigation capabilities. However, 30-50% of time is still spent on unplanned work.
- Advantage: Teams at this maturity level have more advanced metrics as well as SLOs to help pre-empt customer impact. This allows for data-driven tradeoffs in prioritizing reliability work alongside feature work. More mature teams make smaller, faster changes and can better localize the blast radius of incidents, so the majority of incidents typically fall in the Sev2 or Sev3 categories. At this point, less than 30% of time is spent on unplanned work.
- Leader: This level of maturity is one that less than 1% of enterprise companies have achieved today. It is characterized by advanced practices such as graceful service degradation and fault tolerance in order to minimize customer impact even during the most unexpected events (ie massive, sudden changes in scale). Customers will see less than 1% of incidents and 20% or less time is spent on unplanned or reactive work.
While achieving the Leader stage may seem nearly impossible, it’s not out of reach for dedicated teams. Rather than try to reach this level all at once, however, teams should look at small, incremental improvements that allow them to gradually build their metrics base, as illustrated in the case study below.
A metrics case study
At the beginning of 2019, one of our customers—a global eCommerce company— wasn’t tracking any of its incidents. We helped the team hone in on a few basic metrics to start with, such as the cost of time spent on incidents, incidents by severity levels, and percentage of time spent on planned work (ie features) vs. unplanned work (ie incidents, bugs). During the first half of the year, the team worked hard to build those metrics.
In the second half of the year, the team had a solid baseline from which to understand trends and improvement opportunities from the metrics. At the checkpoint, the team identified that 45% of total engineering time was spent on unplanned work, which was equivalent to costing $200K per month.
The majority of the incidents happened on the product page in regards to load time and checkout process failures. With this data, the team began doing deeper triage to understand what caused incidents for these points in the user journey. Further investigation showed that the failures were associated with database tag and API to 3rd party fraud services and payment integrators.
During Q1 in 2020, we helped the team build a focused improvement that consisted of the following:
- Rewrite the database queries and indexes to improve quality and performance.
- Improve the API connection handling and error handling.
- Replace one of the fraud service providers.
- Make changes on the CDN provider to improve the speed of dynamic objects and increase the TTL of static objects.
After Q1 of 2020, the team ran the reports again and saw a 76% reduction of incidents on the key user journey flows (product pages and checkout process). The percentage of total engineering time spent on unplanned work dropped by 40%. While this isn’t the end of their journey to understand operational heath, it’s a great starting point.

How Blameless can help identify and establish useful metrics
If you are looking to establish metrics that allow you to understand your service’s operational health, Blameless’ Reliability Insights features can help. We’ll show you how to explore and analyze your DevOps data, and share insights with other stakeholders such as executives and customer success. Our dashboards facilitate proactive identification of patterns and signals from the noise. Custom and prescriptive dashboards provide some of the more common metrics around your reliability so you can hit the ground running with informed data. This data is compiled in reports that cover business impacting metrics that pertain to all levels of stakeholders. These out-of-the-box reports include:
- Incidents by type
- Incidents by severity
- MTT* metrics and incident duration
- Planned versus unplanned work If you want to learn more about metrics to help your business and other SRE best practices, reach out to us for a demo.
If you enjoyed this post, check out these resources:


Top comments (0)