This post was originally written on my personal website, where the charts and plots are interactive. If you are missing that, check out the original.
I like to have everything in my life tracked in some way. Preferably, knowingly (Looking at you, Facebook), cause it allows you to analyze the data and find interesting things (Might be related with becoming a data scientist)! I've always been a fan of the features provided by Last.fm to track you listening behaviour across apps and platforms. It allows you to see stuff like your favorite artists per month, or your affinity with certain genres over time like in the image below.
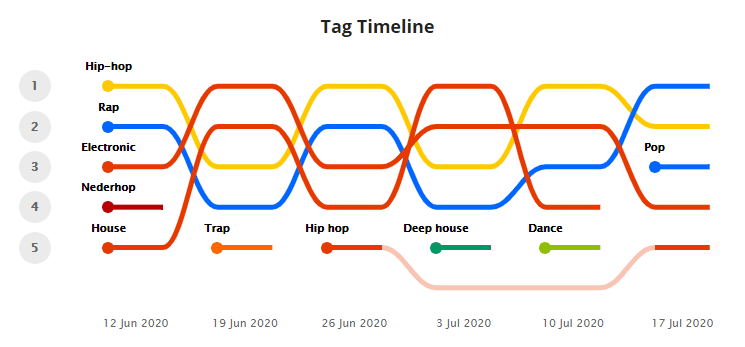
Buuuuuut, like Last.fm, most of these analyses are paid completely or partly. In the case of Last.fm, you get this plot for free but anything more will cost you some paper. I'm Dutch, so let's see if we can do it ourselves!
I wanted to have my listening history, and currently there is an API call that provides that functionality. However, I wanted to do this at the start of 2019 (Last year was pretty busy, so I didn't get around to doing this until now 😅) and this wasn't available back then, or at least I couldn't find it. Spotify, like many other companies, has an option to download your personal information. Unfortunately, this data only contained data for three months (they upped it to a year now, which is great!).
But, given this limitation, the only way I could think of to get this was to ask Spotify for my personal data. Under the GDPR, they are required to provide this information, so I thought this had a good shot. Well, after e-mailing back and forth a whole bunch of times, eventually I got in touch with the Data Privacy Office and they provided me with my complete listening history!
So that's the data that we'll be working with. Like I said, I requested the data in early 2019, so my history goes from my beginning of Spotify (ca. 2013) until then. So lets see what we're dealing with.
The Data ✨
I received one main file from spotify called EndSong.json which had json items as follows. In total, I got 39,229 songs played, which is quite a lot and definitely enough to do some interesting things with!
{
    "ts":"2013-10-09 20:03:57 UTC",
    "username":"xxxxxxxxxx",
    "platform":"xxxxxxx",
    "ms_played":"5969",
    "conn_country":"NL",
    "ip_addr_decrypted":"xx.xx.xx.xx",
    "user_agent_decrypted": "xxxxxxxxxxx",
    "master_metadata_track_name":"You Make Me",
    "master_metadata_album_artist_name":"Avicii",
    "master_metadata_album_album_name":"You Make Me",
    "reason_start":"click-row",
    "reason_end":"click-row",
    "shuffle":false,
    "skipped":false,
    "offline":false,
    "offline_timestamp":"0",
    "incognito_mode":false,
    "metro_code":"0",
    "longitude":0,
    "latitude":0
}
For our analysis, we're gonna use the ol' trusty Pandas. The data is in the json-lines format, so we use the python json-lines package to read our data. We'll also drop some useless columns and convert the timestamp column to a python datetime object. Furthermore, we use the UTF-8 encoding while reading our data, to support tokens that would otherwise be malformed like the ë character. Lastly, we also create separate columns for many of our time attributes like year, month and day, since this makes it easy for filtering during plotting.
lines = []
for i in json_lines.reader(open('data/EndSong.json', encoding='utf-8')):
    lines.append(i)
df = pd.DataFrame(lines)

df = df.drop(['username', 'user_agent_decrypted', 'incognito_mode', 'platform', 'ip_addr_decrypted'], axis=1)
df.ts = pd.to_datetime(df.ts)
df['date'] = df.ts.dt.date
df['year'] = df.ts.dt.year
df['month'] = df.ts.dt.month
df['day'] = df.ts.dt.day
df['dow'] = df.ts.dt.dayofweek
df['hour'] = df.ts.dt.hour
df.head(4)
| ts | ms_played | conn_country | master_metadata_track_name | master_metadata_album_artist_name | master_metadata_album_album_name | reason_start | reason_end | shuffle | skipped | ... | city | region | episode_name | episode_show_name | date | year | month | day | dow | hour | |
|---|---|---|---|---|---|---|---|---|---|---|---|---|---|---|---|---|---|---|---|---|---|
| 0 | 2013-10-09 20:24:30+00:00 | 15010 | NL | Wild for the Night (feat. Skrillex & Birdy Nam... | A$AP Rocky | LONG.LIVE.A$AP (Deluxe Version) | unknown | click-row | False | False | ... | NaN | NaN | NaN | NaN | 2013-10-09 | 2013 | 10 | 9 | 2 | 20 |
| 1 | 2013-10-09 20:19:20+00:00 | 68139 | NL | Buzzin' | OVERWERK | The Nthº | unknown | click-row | False | False | ... | NaN | NaN | NaN | NaN | 2013-10-09 | 2013 | 10 | 9 | 2 | 20 |
| 2 | 2013-10-09 20:21:54+00:00 | 23643 | NL | Blue | Gemini | Blue EP | unknown | click-row | False | False | ... | NaN | NaN | NaN | NaN | 2013-10-09 | 2013 | 10 | 9 | 2 | 20 |
| 3 | 2013-10-09 20:20:29+00:00 | 68063 | NL | Blue | Gemini | Blue EP | unknown | click-row | False | False | ... | NaN | NaN | NaN | NaN | 2013-10-09 | 2013 | 10 | 9 | 2 | 20 |
Yearly & Monthly behaviour 📆
One of the first things that might be interesting to see is how my usage of Spotify has changed over the years. For this, we can easily plot the number of songs player by year and by month.

In the plots above you see my total songs listened. It immediately becomes clear that I got my data in early 2019, given the drop in 2019 and lack of data in 2020. But what is interesting is the steady increasing line the previous years. It shows that I slowly started using spotify more and more. The start coincides with when I started paying for Spotify as well, which is not very surprising (Yay for no ads and song selection 🤗).
When looking at the number of songs per month, we can still see a decline in listening activity since the spike at October 2018. The peak that ranges from September 2018 to November 2018 can be explained by me starting a new internship where I was playing spotify while working the whole day. In October my total songs listened more than doubled compared to only two months earlier (1615 to 3273 songs played).
Furthermore, we can see that I also used Spotify for a short while in 2016, but stopped using it again for about a year. Then I picked it up again in 2017 and never stopped using it afterwards. This is likely because I was using the web version of Spotify for a while, where you can use adblock to block the ads. But not being able to use it on your phone reduced the utility of Spotify pretty significantly, so I switched back over to my previous way, which was a combination of Poweramp and Google Play Music.
Daily behaviour 🕺
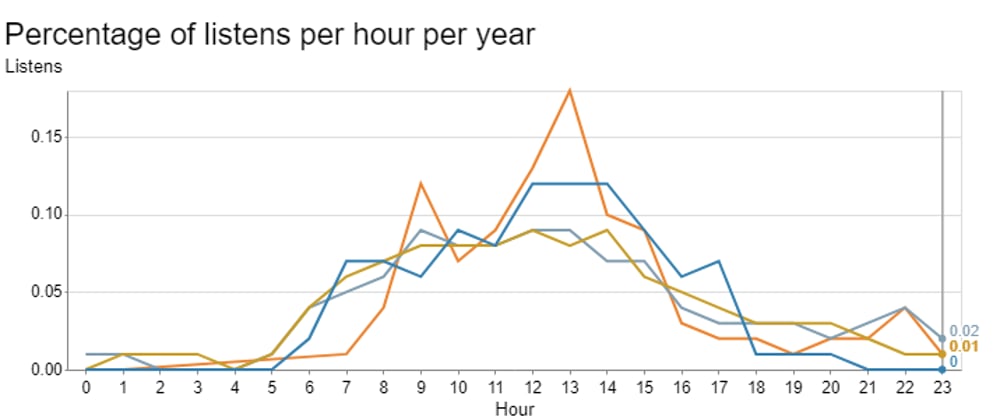
Well, I'm already learning a lot about Altair, cause creating this plot in its current form easily took three hours. Altair does not like it when you aggregate a value in several places. But the result is also quite a nice visual. I plotted the daily distribution per hours per year. Now, the value is the sum of the whole year, so it's no wonder that the differences are really similar to what we say in the yearly distribution. More interesting would be the percentage per hour per year, which would tell me something about my listening behaviour throughout the years.
The yearly visuals only show 2016 till 2019, because the others years don't have enough data.

There are several noteworthy things:
- In 2016, there was a big spike between 13:00 and 14:00. 2016 is split between my third and fourth year at university, of which in the fourth year I also was on the board of the e-sports association. I just barely didn't have enough credits to get my bachelor's degree in my third year, so my fourth year was pretty empty. The combination likely contributed to many days where I had lunch and then closed myself of with music, to work on association matters.
- In 2016, there is a big spike at 9:00. This makes sense, because that was always the time I was cycling to my university. Over the years, I started listening to podcasts more, which is why you can see the 9:00 value decline over 4 years.
- In 2018 and 2019, my listening during evening hours decreased quite significantly. Earlier, I had a spike at 22:00 but this completely faded during the first month of 2019. What happened? Not sure, to be frank. It might be that I had more nights planned with friends?
- In 2017 and 2018, I somehow play 4% of my music daily before 7:00. Now, this is essentially impossible since I almost never get up before 7. I'm not sure why this is shown to be the case.
Tip: I've since learned that you can so things like define variables and aggregate values in Altair. An example can be found on their website. However, did not go back and redo the analyses using that. That's for another time. 😉
Weekly behaviour
To get a clear view of weekly listening behaviour, we can create a heatmap with the hours and day of week, with the color indicating the number of listens on that hour. We can see that the working week made a lot of difference, with listening mainly focused on Tuesday, Wednesday, Thursday and Friday, with a little bit as well on Monday afternoon. We all need to wake up a bit first on Monday morning ☕.
Interestingly enough, we see some hours that have no plays at all like Monday morning 2:00-3:00. I'm a bit skeptic that I never plays anything at all there, but I don't have an explanation for it.

Genres 🎧
Now that we have some insight into my listening behaviour, we can analyze what I listen to a bit more closely. For example, what genres do I listen to most and how do these change? Here we get a bit closer to the visualization we got from Last.fm.
However, before we can do that, we need to get the genres associated with our songs. This was not included in the data Spotify sent over, so we need to use their API to get this information. Spotify does not apply categories per song, but rather per artist. Internally, Spotify uses special URIs to indicate different concepts like artists, songs and albums. For example, a track can be indicated with spotify:track:6rqhFgbbKwnb9MLmUQDhG6.
That relates for example to
.
These URIs refer to a specific object, whereas the artist in the data I received does not. So we need to use the Spotify search function to retrieve the correct Spotify object of an artist, and then we can retrieve the genres from there. Now, either the data they sent is somewhat corrupted or their music management is a bit lackluster, because there were still quite some artists without an Spotify URI and/or without any defined genres. The latter makes sense, since this takes a lot of work by Spotify.
Let's have a short look at the data. I'm showing the first two rows (so the genres of the first two songs) and all the columns. The columns just have a number, but indicate the first to twenty-first genre of each song.
| 0 | 1 | 2 | 3 | 4 | 5 | 6 | 7 | 8 | 9 | ... | 11 | 12 | 13 | 14 | 15 | 16 | 17 | 18 | 19 | 20 | |
|---|---|---|---|---|---|---|---|---|---|---|---|---|---|---|---|---|---|---|---|---|---|
| 0 | east coast hip hop | hip hop | pop | pop rap | rap | trap music | NaN | NaN | NaN | NaN | ... | NaN | NaN | NaN | NaN | NaN | NaN | NaN | NaN | NaN | NaN |
| 1 | catstep | complextro | edm | electro house | NaN | NaN | NaN | NaN | NaN | NaN | ... | NaN | NaN | NaN | NaN | NaN | NaN | NaN | NaN | NaN | NaN |
Because we added all genres for each artist as a new column, we have quite a wide dataframe. The artist with the most genres has 21(!) genres. Let's see who that is.
| ts | ms_played | conn_country | master_metadata_track_name | master_metadata_album_artist_name | master_metadata_album_album_name | reason_start | reason_end | shuffle | skipped | ... | 11 | 12 | 13 | 14 | 15 | 16 | 17 | 18 | 19 | 20 | |
|---|---|---|---|---|---|---|---|---|---|---|---|---|---|---|---|---|---|---|---|---|---|
| 32948 | 2018-10-26 21:01:59+00:00 | 255626 | NL | Grounded | Pavement | Crooked Rain Crooked Rain | clickrow | trackdone | False | NaN | ... | indie pop | indie rock | lo-fi | modern rock | new wave | noise pop | noise rock | post-punk | rock | slow core |
It's some artist called Pavement! I've no idea who that is, but still interesting to see. The artist seems to be in the indie rock segment, where there are many subgenres, so it's not that surprising. I've heard that metal has a similar amount of subgenres, so it would be cool to do this analysis for a metal fan 🤘.
But, clearly I am not in that segment. Lets see how many genres an average artist of mine has. We'll exclude artists with zero genres.

If we take the percentage of the artists with three or fewer genres, we see this is 52%. This is quite high, and means many people are pretty specific with regards to what genres they fall into for Spotify. We see quite a long tail distribution, with only 27% having more than 5 genres specified and only 2.8% more then 10 genres!
In conclusion
We have done a pretty thorough analysis of my listening history on Spotify. We evaluated the high level listening behaviour on a monthly and yearly basis. We have also seen my daily listening behaviour and how it has changed throughout the years. We also started on the analysis of the genres, which we will continue in part 2!
It has been really interesting to see how my preferences with regards to music over these years, and it is definitely contributing to my 'have everything tracked' KPIs. Since all of Spotify's data is accessible through the API, I might consider making a dashboard for these insights that updates automatically.

Unfortunately, we didn't get to see the really cool stuff in this post. Things like recreation of the last.fm image and the changes in genres over time are very interesting, and I would have loved to already be able to show those. Please check out part 2 for that. I'll add links to that here as soon as that's out.
Topics covered in part 2:
- What are my top genres?
- Correlation between genres.
- How have my genres changed over time?
- Recreation of the Last.fm image.
Learnings
This blogpost has been a huge learning experience for me. It was my first time using Fastpages. It was my first time writing a blogpost in a jupyter notebook as well, and it was also my first time using Altair! All of those experiences were quite positive, and I especially like getting more familiar with Altair. Having a Grammar of Graphics tool in your toolbelt is an extremely valuable thing in the world of data science, although you might not use it on a daily basis.
If you liked this blogpost, don't hesitate to reach out to me on linkedin or twitter. 😊

![]()


Top comments (1)
Yesss this is exactly the type of content I love to see, great work!!! I've been meaning to get around to some Spotify data exploration myself, maybe this will be the nudge I needed to finally get around to it lol