
Part of a series of posts to support an up-coming online event, the Innovate AI/ML on February 24th, from 9:00am GMT - you can sign up here
- Part 1 - Installation and configuration of Managed Workflows for Apache Airflow
- Part 2 - Working with Permissions
- Part 3 - Accessing Amazon Managed Workflows for Apache Airflow
- Part 4 - Interacting with Amazon Managed Workflows for Apache Airflow via the command line
- Part 5 - A simple CI/CD system for your development workflow
- Part 6 - Monitoring and logging <- this post
- Part 7 - Automating a simple AI/ML pipeline with Apache Airflow
In this post I will be covering Part 6, where to find logs to help you understand and troubleshoot your Apache Airflow workflows, and how you can monitor your Apache Airflow environments. Specifically I will cover a couple of things:
- Logging in MWAA
- Monitoring and dashboards
What will you need
- An AWS account with the right level of privileges
- An environment with the AWS CLI tools configured and running
- Access to an AWS region where Managed Workflows for Apache Airflow is supported
- An environment of Amazon Managed Workflows for Apache Airflow already setup - you should ideally have followed part one here.
Logs
As a developer or operator, Apache Airflow provides a rich amount of information and logging to help you understand how your workflows (DAGs) are running, as well as the state of the system in which they run. I am not going to cover the logs that you can find via the Apache Airflow UI, as these are already covered in the documentation for Apache Airflow.
What I want to look at in more details is what logs are available and how you might access these when needing to operate or troubleshoot your MWAA environments. A typical Apache Airflow architecture has a number of components (Web Server, Scheduler, Worker, etc) and each of has the option of producing logs that can help you understand in more detail how your system is working. With MWAA, those log files are configured when you setup your environment, and you have the choice of setting these to different levels. These rely on an AWS service called Amazon CloudWatch.
When configuring a MWAA environment, the following logs are available and that you can configure (either disabling or enabling, and enabling at a specific detail level)
- WebServer - log files for the Apache UI component
- DAGProcessing - log files are created per workflow you have, and you can use this to understand more about how your workflow is working with MWAA.
- Scheduler - log files for the task schedule
- Task - for each task, a log file is generated
- Worker - log files for the worker nodes
For task and workflow logs, you will probably find it easier to use the Apache Airflow UI to view the log information. That said, if you are experience errors or unexplained issues, it is good to know that these logs can be enabled.
Security! A quick note here. Be intentional in your approach to how you provide access to the logs in your CloudWatch log groups. There might be information that is disclosed in your log files that might be sensitive, so you should review this and secure appropriately.
We can use the following command to list all the log groups. Depending on your environment this might return a big list.
aws logs describe-log-groups
This is just an extract from mine, as you can see here are the log groups that have been created when I set up the MWAA environment.
...
 {
            "logGroupName": "airflow-ricsue-dublin-WebServer",
            "creationTime": 1610632186603,
            "metricFilterCount": 0,
            "arn": "arn:aws:logs:eu-west-1:{aws-account-id}:log-group:airflow-ricsue-dublin-WebServer:*",
            "storedBytes": 73720409
        },
        {
            "logGroupName": "airflow-ricsue-dublin-Worker",
            "creationTime": 1610632188363,
            "metricFilterCount": 0,
            "arn": "arn:aws:logs:eu-west-1:{aws-account-id}:log-group:airflow-ricsue-dublin-Worker:*",
            "storedBytes": 9515445
        },
...
And we can use the aws logs tail to stream these logs which can be super helpful when we want to know what is going on.
aws logs tail "airflow-ricsue-dublin-WebServer"
Note! The above command works with the aws cli v2 only.
This generates output as you would expect from a typical tail command:
2021-02-04T19:34:18.255000+00:00 webserver_console_ip-10-0-27-51.eu-west-1.compute.internal_1611138773.8887548.log 10.0.42.53 - - [04/Feb/2021:19:34:18 +0000] "GET /health HTTP/1.1" 200 12 "-" "ELB-HealthChecker/2.0"
2021-02-04T19:34:37.781000+00:00 webserver_console_ip-10-0-27-51.eu-west-1.compute.internal_1611138773.8887548.log [2021-02-04 19:34:37 +0000] [30] [INFO] Handling signal: ttin
2021-02-04T19:34:37.841000+00:00 webserver_console_ip-10-0-27-51.eu-west-1.compute.internal_1611138773.8887548.log [2021-02-04 19:34:37 +0000] [11232] [INFO] Booting worker with pid: 11232
2021-02-04T19:34:37.868000+00:00 webserver_console_ip-10-0-27-51.eu-west-1.compute.internal_1611138773.8887548.log [2021-02-04 19:34:37,802] {{logging_config.py:47}} INFO - Successfully imported user-defined logging config from log_config.LOGGING_CONFIG
2021-02-04T19:34:38.524000+00:00 webserver_console_ip-10-0-27-51.eu-west-1.compute.internal_1611138773.8887548.log [2021-02-04 19:34:38,523] {{__init__.py:50}} INFO - Using executor CeleryExecutor
2021-02-04T19:34:40.888000+00:00 webserver_console_ip-10-0-27-51.eu-west-1.compute.internal_1611138773.8887548.log [2021-02-04 19:34:40 +0000] [30] [INFO] Handling signal: ttou
2021-02-04T19:34:40.920000+00:00 webserver_console_ip-10-0-27-51.eu-west-1.compute.internal_1611138773.8887548.log [2021-02-04 19:34:40 +0000] [11228] [INFO] Worker exiting (pid: 11228)
What we see, the level of detail will be determined by whether we set the logs to INFO, WARNING, ERROR and CRITICAL with each level sending only those defined events to the logs (INFO being the most verbose, CRITICAL the least).
You can change these settings when you set the environment up (via the Console GUI or the CloudFormation template that I walked you through in the first part of this series) but you can also change this via the command line
aws mwaa update-environment --name {your-mwaa-envirnment} --logging-configuration 'DagProcessingLogs={Enabled=true,LogLevel="INFO"},SchedulerLogs={Enabled=True,LogLevel="INFO"},TaskLogs={Enabled=false,LogLevel="DEBUG"},WebserverLogs={Enabled=true,LogLevel="CRITICAL"},WorkerLogs={Enabled=false,LogLevel="INFO"}' --region={aws-region}
which will generate output similar to
{
    "Arn": "arn:aws:airflow:eu-west-1:704533066374:environment/apache-airflow-aimlinnovate"
}
When you do this, your MWAA environemnt will start updating so it will take 10-15 minutes to make the configuration change, restart all the services and come back online.
When we look at the logging information in the console, we can now see it has changed to reflect the new settings:

Monitoring
We have seen how we can access the Apache Airflow logs for the various components. The way that MWAA is integrated with Amazon CloudWatch however allows you to do more. Via a number of different metrics, which you can find via the MWAA documentation, Amazon MWAA metrics, you are able to capture metrics, build dashboards and set alarms that will help you stay on top of your workflows and your Apache Airflow environment.
Capture Metrics
You can capture a number of metrics about your workflows or the MWAA environment in which they are running. The detailed list of the metrics are in the documentation link above, but to summarise here:
- Job-based metrics – includes data about Apache Airflow jobs, such as a count of start and end
- Functional metrics – includes data about the Amazon MWAA environment, such as DAG processing, task scheduling, and workers
- Workflow based metrics – includes data specific to workflows, such as processing duration
- Task-based metrics – includes data for specific DAG tasks, such as Duration or Successes
- Operator-based metrics – includes data about metrics related to specific operators, for example the success rate for a particular operator
- Pool-based metrics – includes data about a specific pool - you can understand more about this by reading the Apache Airflow documentation here
What this means is that you are able to easily collect these data points for your MWAA environment, workflows, tasks and operators and then start to build useful dashboards to help you monitor your environments and workflows and stay ahead of any issues or problems that might occur.
Build Dashboards
A really nice feature of Amazon CloudWatch is the ability to create dashboards, taking input from the metrics and then using some simple tools to arrange/create dashboards. Here is a simple dashboard that allows me to track my environment health.
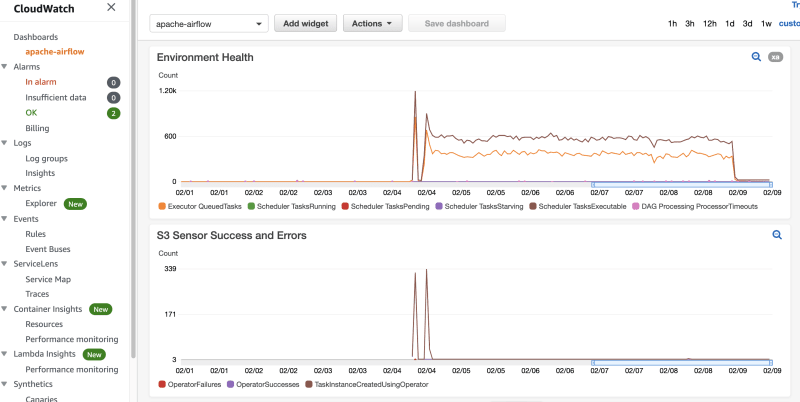
Take a look at this very quick demo of me using some of those metrics (I am using Operator and Pool metrics) and create a very simple dashboard.
Setting Alarms
To finish this section off, another great feature of Amazon CloudWatch is the ability to take those metrics data and create alarms that help you manage your environments by notifying you when certain metrics are exceeding certain thresholds. Lets say for example I had a workflow that used an Amazon S3 sensor to process some data, and I wanted to be alerted if errors exceeded a certain threshold. This might help me stay on top of an underlying issue and allow me to respond quickly to that problem.
I can use the Alarms section in CloudWatch to create an alarm based on a metric - here I have chosen that I wan to trigger the MWAA OperatorFailure metric for the S3SensorHook (which is the operator that interacts with Amazon S3) when it exceeds 5 failures over a minute period. CloudWatch alarms are flexible and you can set a number of criteria.
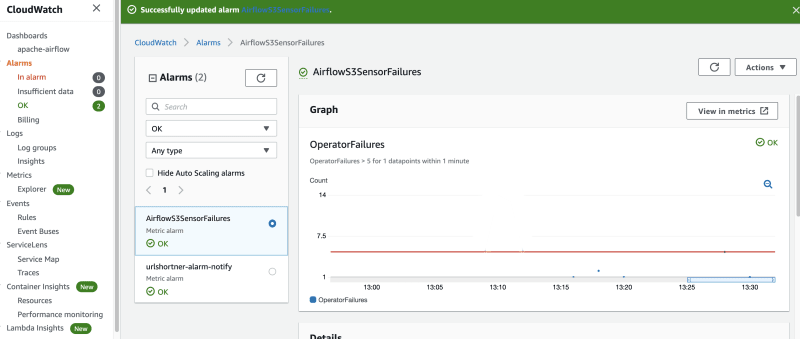
I create a version of a workflow which has a deliberately misconfigured Amazon S3 bucket and I know will generate failures.

When I trigger these, we can see the blue dots surrounded by circles, the failures start increasing.

Until the Alarm gets triggered.
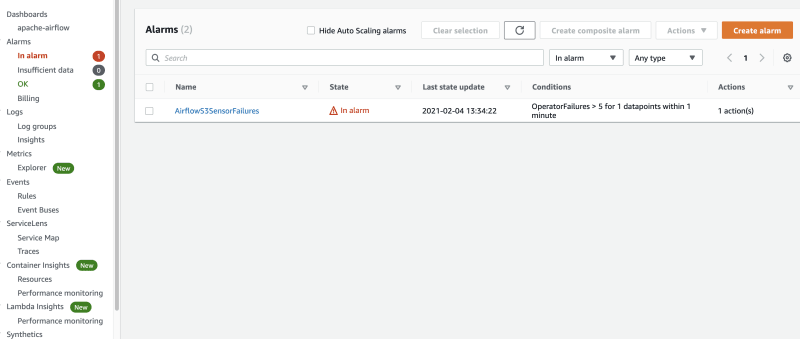
I have configured this Alarm to send me an email, so I get an email telling me there is a problem that needs my attention.

I fix the issue, and then the system returns to normal.

Hopefully this has given you an idea of what you can do with Amazon CloudWatch. If you are using other tools however, then you may be able to interact with CloudWatch metrics as we will see in the next section.
Grafana
If you are already using other tools such as Grafana to create visualisations and dashboards, then you can easily integrate CloudWatch metrics and logs.
I created a new IAM policy that would be used to grant Grafana access to the CloudWatch logs for my MWAA environments. This is what my policy looked like:
{
    "Version": "2012-10-17",
    "Statement": [
        {
            "Sid": "AllowReadingMetricsFromCloudWatch",
            "Effect": "Allow",
            "Action": [
                "cloudwatch:DescribeAlarmsForMetric",
                "cloudwatch:DescribeAlarmHistory",
                "cloudwatch:DescribeAlarms",
                "cloudwatch:ListMetrics",
                "cloudwatch:GetMetricStatistics",
                "cloudwatch:GetMetricData"
            ],
            "Resource": "*"
        },
        {
            "Sid": "AllowReadingLogsFromCloudWatch",
            "Effect": "Allow",
            "Action": [
                "logs:DescribeLogGroups",
                "logs:GetLogGroupFields",
                "logs:StartQuery",
                "logs:StopQuery",
                "logs:GetQueryResults",
                "logs:GetLogEvents"
            ],
            "Resource": "*"
        },
        {
            "Sid": "AllowReadingTagsInstancesRegionsFromEC2",
            "Effect": "Allow",
            "Action": [
                "ec2:DescribeTags",
                "ec2:DescribeInstances",
                "ec2:DescribeRegions"
            ],
            "Resource": "*"
        },
        {
            "Sid": "AllowReadingResourcesForTags",
            "Effect": "Allow",
            "Action": "tag:GetResources",
            "Resource": "*"
        }
    ]
}
I then created a new IAM Group, and attached this policy to this group. The next step was to create a new IAM user that only had API access to my AWS account, and was only a member of this group. The Access/Secret key you need to keep as you will use it to setup the connectivity between Grafana and your AWS environment.
I wanted to use the Grafana hosted service and I followed this document to setup the Grafana side of things.
When setting up your dashboard, when configuring your data source you should select CloudWatch as your datasource. The MWAA service does not appear in the drop down list in NameSpace when creating your dashboard, so I had to manually enter "AmazonMWAA" and then the CloudWatch metric names would appear.

I could then quickly create a simple dashboard as follows:
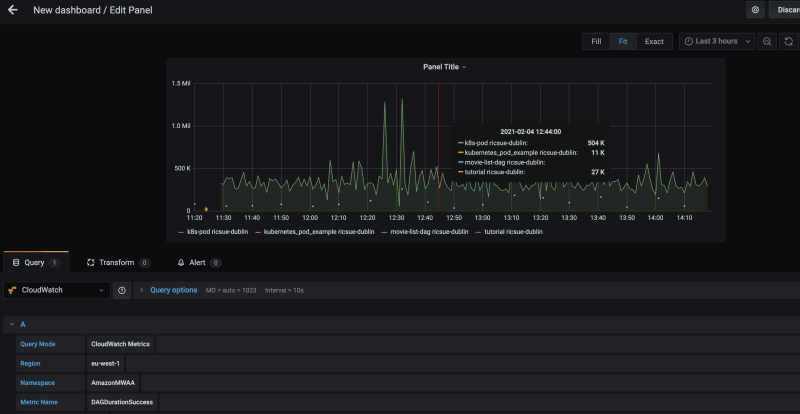
Creation of dashboards in Grafana dashboards is outside the scope of this post, but you should have everything you need to get going now. I did find and spend some time exploring this great resource that will probably be a great help if you want to go down this path.
Security Monitoring
Security monitoring of your MWAA environment is important when looking to understand and troubleshoot various security related problems that might occur.
MWAA integrates with an AWS service called AWS CloudTrail which records API call to AWS and you can read more about this in the documentation, Monitoring Amazon Managed Workflows for Apache Airflow. From the CloudTrail console, you can use the "Event history" menu option to find events that are of interest. This is what a typical event captured in CloudTrail looks like:
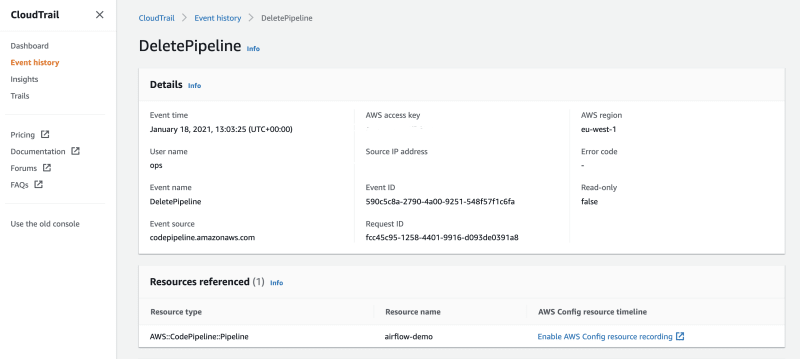
{
    "eventVersion": "1.08",
    "userIdentity": {
        "type": "IAMUser",
        "principalId": "AIxAJxANxIxBDxAVFxXxO",
        "arn": "arn:aws:iam::{aws-account-id}:user/xxx",
        "accountId": "{aws-account-id}",
        "accessKeyId": "xxxxxxxxxxxxxxxxxxxxx",
        "userName": "xxx",
        "sessionContext": {
            "sessionIssuer": {},
            "webIdFederationData": {},
            "attributes": {
                "mfaAuthenticated": "false",
                "creationDate": "2021-01-18T08:54:32Z"
            }
        }
    },
    "eventTime": "2021-01-18T13:03:25Z",
    "eventSource": "codepipeline.amazonaws.com",
    "eventName": "DeletePipeline",
    "awsRegion": "eu-west-1",
    "sourceIPAddress": "xx.xx.xx.xx",
    "userAgent": "Mozilla/5.0 (Macintosh; Intel Mac OS X 10_14_6) AppleWebKit/537.36 (KHTML, like Gecko) Chrome/87.0.4280.141 Safari/537.36",
    "requestParameters": {
        "name": "airflow-demo"
    },
    "responseElements": null,
    "requestID": "fcc45c95-1258-4401-9916-d093de0391a8",
    "eventID": "590c5c8a-2790-4a00-9251-548f57f1c6fa",
    "readOnly": false,
    "eventType": "AwsApiCall",
    "managementEvent": true,
    "eventCategory": "Management",
    "recipientAccountId": "{aws-account-id}"
}
When I was creating the Lambda function in a previous post, I used this to help me troubleshoot the issue I was getting with "Access Denied" messages. As you can see here, when I was looking to gather info on the problem I could see I was getting an Access Denied against the API. When I looked further, this led to me see I had defined the wrong API in my policy. I fixed the policy and this error went away.
{
    "eventVersion": "1.08",
    "userIdentity": {
        "type": "AssumedRole",
        "principalId": "AROx2ICxROxDBAxC2xM76:triggerMwaaDAG",
        "arn": "arn:aws:sts::704533066374:assumed-role/triggerMwaaDAGRole/triggerMwaaDAG",
        "accountId": "{aws-account-id}",
        "accessKeyId": "xxxxxxxxxxxxxxxxxxxx",
        "sessionContext": {
            "sessionIssuer": {
                "type": "Role",
                "principalId": "AROx2ICxROxDBAxC2xM76",
                "arn": "arn:aws:iam::{aws-account-id}:role/service-role/triggerMwaaDAGRole",
                "accountId": "{aws-account-id}",
                "userName": "triggerMwaaDAGRole"
            },
            "webIdFederationData": {},
            "attributes": {
                "mfaAuthenticated": "false",
                "creationDate": "2021-02-02T11:10:16Z"
            }
        }
    },
    "eventTime": "2021-02-02T11:10:17Z",
    "eventSource": "airflow.amazonaws.com",
    "eventName": "CreateCliToken",
    "awsRegion": "eu-west-1",
    "sourceIPAddress": "xx.xx.xx.xx",
    "userAgent": "Boto3/1.16.63 Python/3.7.9 Linux/4.14.209-112.339.amzn2.x86_64 exec-env/AWS_Lambda_python3.7 Botocore/1.19.63",
    "errorCode": "AccessDenied",
    "requestParameters": {
        "Name": "dublin-ricsue"
    },
    "responseElements": {
        "message": "User: arn:aws:sts::{aws-account-id}:assumed-role/triggerMwaaDAGRole/triggerMwaaDAG is not authorized to perform: airflow:CreateCliToken on resource: arn:aws:airflow:eu-west-1:{aws-account-id}:environment/dublin-ricsue"
    },
    "requestID": "2bccd5ac-cd1f-4c14-bc30-8b95d6bf547a",
    "eventID": "940ac6f5-a81c-4139-a213-698f157b7565",
    "readOnly": false,
    "eventType": "AwsApiCall",
    "managementEvent": true,
    "eventCategory": "Management",
    "recipientAccountId": "{aws-account-id}"
}
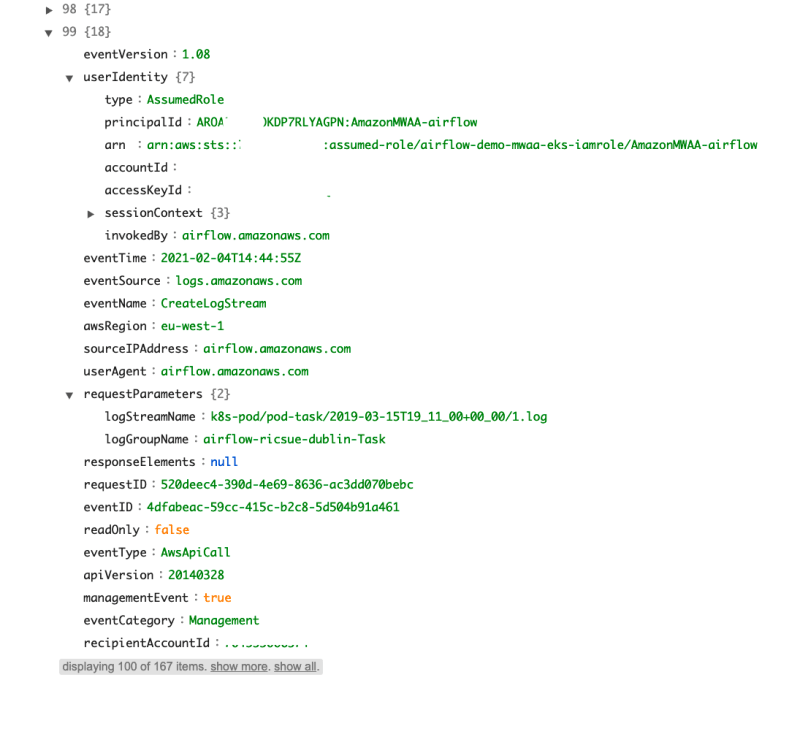
Using CloudTrail is something you should be aware of and understand how you can use it. One of the very powerful features mentioned in the documentation is to create what is called a CloudTrail Trail, where in effect you create a secure Amazon S3 bucket and you stream a set of defined data to that bucket for later analysis. I am not going to get into that in this post, but just want to show you what a typical output of that process looks like. Here you can see a sample event captured, which as you can see is the Apache Airflow service accessing some of the AWS APIs.
What else do I need to know?
Before concluding it is worth talking about the addition costs associated with monitoring and debugging your MWAA environments.
Each MWAA environment can be configured to generate logs within Amazon Cloud Watch, and the level/amount of logging you decide to configure may lead to increase costs depending on the scale of your environments. You should familiarise yourself with the pricing details to understand and help you estimate/plan your costs. Check out the details in the CloudWatch pricing page here.
If you decide you want to start using CloudTrail to capture trails you should be aware of the pricing details for this, which you can find here.
With both CloudWatch and CloudTrail there is a free tier, and the documentation provides clear details of how much you can expect.
Conclusion
This concludes the sixth post. You will now be able to setup a simple automated workflow that will help you accelerate your developers whilst reducing the permissions and access you need to give those developers to your MWAA environments.
In the next post we will look at monitoring and logging, which will help you troubleshoot issues with your Apache Airflow environment and the DAGs you are developing. It will also help you understand over time how your environments are running, a look at resources and capacity and help you optimise your costs to make sure you are right-sizing your environment.
If there is specific content you want to see, please get in touch.


Top comments (0)