In this post, I will go through the minimum steps to configure Prometheus and Grafana in the existing EKS cluster, which is most likely used for monitoring and alerts.
Configuring Node Groups
Creating new node group
Assuming that there are no pre-existing node groups, let's create one.
First, let's attach IAM role to Kubernetes service account using eksctl.
eksctl create iamserviceaccount \
  --name aws-node \
  --namespace kube-system \
  --cluster $EKS_CLUSTER_NAME \
  --role-name "AmazonEKSVPCCNIRole" \
  --attach-policy-arn arn:aws:iam::aws:policy/AmazonEKS_CNI_Policy \
  --override-existing-serviceaccounts \
  --approve
Now let's head over to AWS Management Console -> EKS -> Your cluster -> Compute -> Add node group.
We HAVE to use EC2 for Prometheus and Grafana, since they will both need volumes mounted to them.
When creating node group, we have to attach an IAM role to EC2 worker nodes. For easy demonstration, I created a new IAM role and attached policies as below.
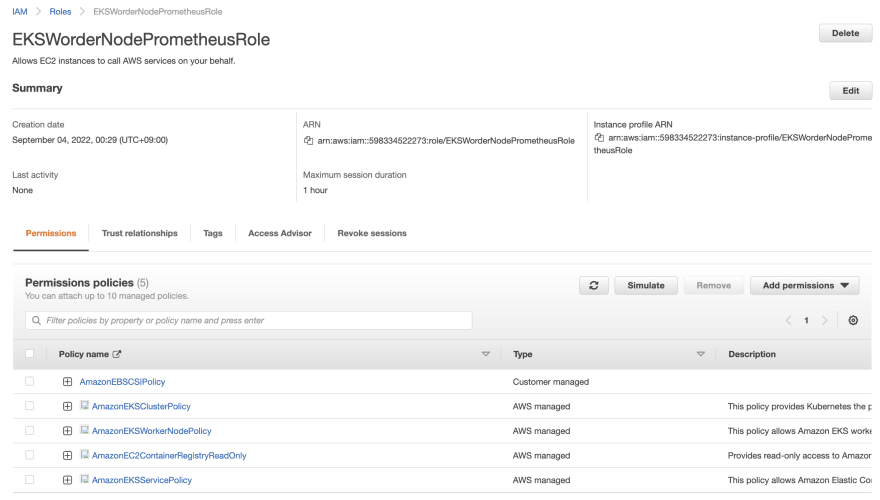
When filling all the information required to create a node group, just make sure to apply values as below.
- EC2 instance type: m5.large
- Subnets: Your private subnets within the VPC that EKS cluster exists.
You can leave all the other values as it is.
To confirm that your EC2 worker nodes are properly running, run the command below. The result should say that 2 pods are running.
$ kubectl delete pods -n kube-system -l k8s-app=aws-node
NAME             READY   STATUS    RESTARTS   AGE
aws-node-6szct   1/1     Running   0          4s
aws-node-nz5cd   1/1     Running   0          8s
aws-ebs-csi-driver
Prometheus and Grafana needs persistent storage attached to them, which is also called PV(Persistent Volume) in terms of Kubernetes.
For stateful workloads to use Amazon EBS volumes as PV, we have to add aws-ebs-csi-driver into the cluster.
Associating IAM role to Service account
Before we add aws-ebs-csi-driver, we first need to create an IAM role, and associate it with Kubernetes service account.
Let's use an example policy file, which you can download using the command below.
curl -sSL -o ebs-csi-policy.json https://raw.githubusercontent.com/kubernetes-sigs/aws-ebs-csi-driver/master/docs/example-iam-policy.json
Now let's create a new IAM policy with that file.
export EBS_CSI_POLICY_NAME=AmazonEBSCSIPolicy
aws iam create-policy \
--region $AWS_REGION \
--policy-name $EBS_CSI_POLICY_NAME \
--policy-document file://ebs-csi-policy.json
export EBS_CSI_POLICY_ARN=$(aws --region ap-northeast-2 iam list-policies --query 'Policies[?PolicyName==`'$EBS_CSI_POLICY_NAME'`].Arn' --output text)
echo $EBS_CSI_POLICY_ARN
# arn:aws:iam::12345678:policy/AmazonEBSCSIPolicy
After that, let's attach the new policy to Kubernetes service account.
eksctl create iamserviceaccount \
  --cluster $EKS_CLUSTER_NAME \
  --name ebs-csi-controller-irsa \
  --namespace kube-system \
  --attach-policy-arn $EBS_CSI_POLICY_ARN \
  --override-existing-serviceaccounts --approve
And now, we're ready to install aws-ebs-csi-driver!
Installing aws-ebs-csi-driver
Assuming that helm is installed, let's add new helm repository as below.
helm repo add aws-ebs-csi-driver https://kubernetes-sigs.github.io/aws-ebs-csi-driver
helm repo update
After adding new helm repository, let's install aws-ebs-csi-driver with below command using helm.
helm upgrade --install aws-ebs-csi-driver \
  --version=1.2.4 \
  --namespace kube-system \
  --set serviceAccount.controller.create=false \
  --set serviceAccount.snapshot.create=false \
  --set enableVolumeScheduling=true \
  --set enableVolumeResizing=true \
  --set enableVolumeSnapshot=true \
  --set serviceAccount.snapshot.name=ebs-csi-controller-irsa \
  --set serviceAccount.controller.name=ebs-csi-controller-irsa \
  aws-ebs-csi-driver/aws-ebs-csi-driver
Configuring Prometheus
First, let's create a new Kubernetes namespace where all Prometheus-related resources will reside in.
kubectl create ns prometheus
We will install Prometheus using helm, so let's add the Prometheus repository to helm and install it running the command below.
# Add helm repositories for Prometheus
helm repo add kube-state-metrics https://kubernetes.github.io/kube-state-metrics
helm repo add prometheus-community https://prometheus-community.github.io/helm-charts

# Install Prometheus
helm upgrade -i prometheus prometheus-community/prometheus \
  --namespace prometheus \
  --set alertmanager.persistentVolume.storageClass="gp2",server.persistentVolume.storageClass="gp2"
Few minutes after installing Prometheus, we can see all the resources created as below.
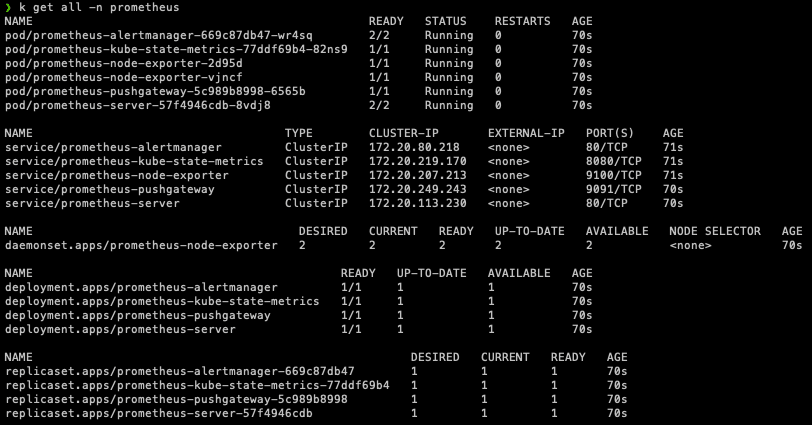
To test if they are working, let's use kubectl.
kubectl port-forward -n prometheus deploy/prometheus-server 8081:9090 &
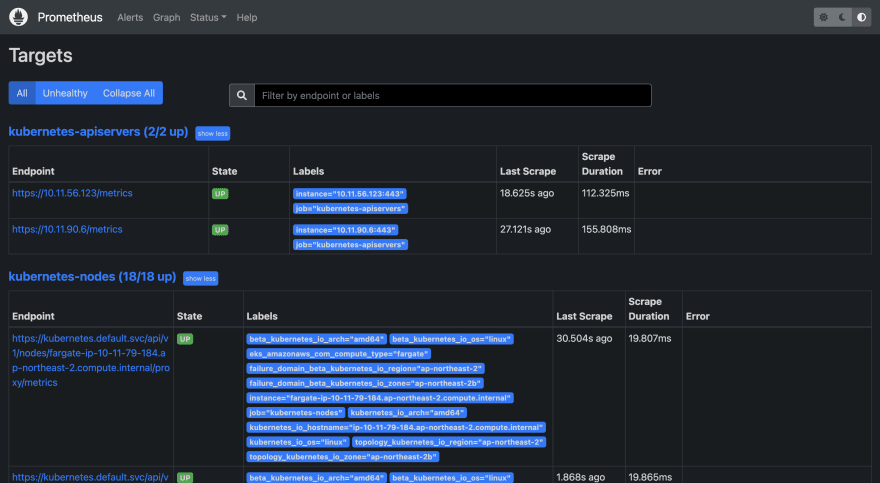
Now let's launch web browser, and go to localhost:8081.
The below web page should be seen if Prometheus has been successfully installed.
Configuring Grafana
As the same as Prometheus, we will create a dedicated Kubernetes namespace for Grafana, and install it using helm.
First let's create a new namespace.
kubectl create ns grafana
We also need a manifest file, which will be used to configure Grafana. Below is an example of the file, called grafana.yaml.
# grafana.yaml
datasources:
  datasources.yaml:
    apiVersion: 1
    datasources:
      - name: Prometheus
        type: prometheus
        url: http://prometheus-server.prometheus.svc.cluster.local
        access: proxy
        isDefault: true
Now let's install Grafana using helm.
# Add helm repository for Grafana
helm repo add grafana https://grafana.github.io/helm-charts

# Install Grafana
helm install grafana grafana/grafana \
    --namespace grafana \
    --set persistence.storageClass="gp2" \
    --set persistence.enabled=true \
    --set adminPassword='YOUR_PASSWORD' \
    --values grafana.yaml \
    --set service.type=NodePort
Before exposing Grafana to the world, let's see how the Kubernetes service running Grafana is defined.

We can see that the target port is 3000, which is the port used by pods running Grafana.
So we have to attach a new Security group to EC2 worker nodes, allowing inbound requests for port 3000.
We can do this by creating a new Security group, and attaching it to EC2 worker nodes in the EC2 console of AWS Management Console.
After applying new security group to EC2 worker nodes, let's define a new Kubernetes ingress, which will provision an ALB.
To make Kubernetes ingress to create an ALB, we have to install aws-load-balancer-controller first.
Let's see how ingress looks like.
apiVersion: networking.k8s.io/v1
kind: Ingress
metadata:
  name: grafana-ingress
  namespace: grafana
  annotations:
    alb.ingress.kubernetes.io/load-balancer-name: grafana-alb
    alb.ingress.kubernetes.io/scheme: internet-facing
    alb.ingress.kubernetes.io/target-type: ip
    alb.ingress.kubernetes.io/subnets: ${PUBLIC_SUBNET_IDs}
    alb.ingress.kubernetes.io/listen-ports: '[{"HTTPS": 443}]'
    alb.ingress.kubernetes.io/certificate-arn: ${ACM_CERT_ARN}
    alb.ingress.kubernetes.io/security-groups: ${ALB_SECURITY_GROUP_ID}
    alb.ingress.kubernetes.io/healthcheck-port: "3000"
    alb.ingress.kubernetes.io/healthcheck-path: /api/health
spec:
  ingressClassName: alb
  rules:
    - host: ${YOUR_ROUTE53_DOMAIN}
      http:
        paths:
          - path: /
            pathType: Prefix
            backend:
              service:
                name: grafana
                port:
                  number: 80
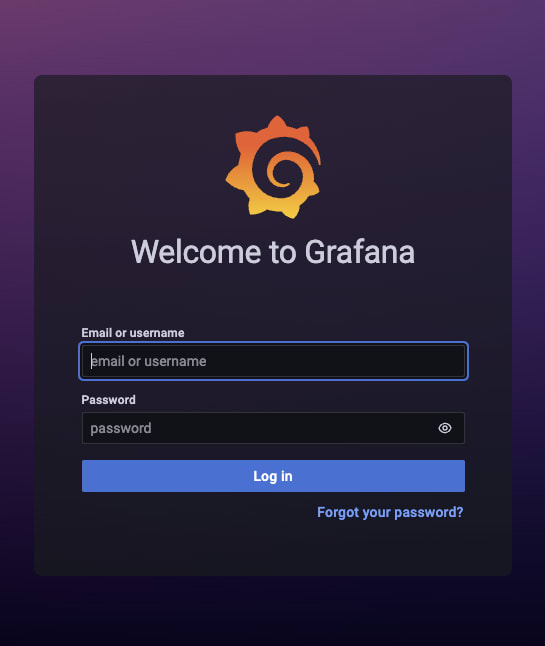
After applying new ingress and having new ALB ready, we can head over to ${YOUR_ROUTE53_DOMAIN} and see that Grafana is ready as below.
That's it! In this post, we created a new node group which will be used by Prometheus and Grafana, and installed and configured both Prometheus and Grafana.
Hope this post helps you!
After importing Grafana dashboard using
3119, I got a new dashboard as below.


Top comments (0)