
In previous articles we created an HTTP REST API server, a CLI, a Bot for Discord and even a game for Nintendo Game Boy Advance.
Today, we will learn how to use OpenTelemetry Go library to create an instrumented application and send traces to a Jaeger instance.
OpenTelemetry

OpenTelemetry is a collection of tools, APIs, and SDKs. Useful to instrument, generate, collect, and export telemetry data (metrics, logs, and traces) to help you analyze your software’s performance and behavior.
OpenTelemetry integrates with popular libraries and frameworks such as Spring, Express, Quarkus, and with a lot of languages, including Go :-).
If you have ever heard of OpenTracing or are used to using it, know that now OpenTracing is deprecated, so it is better to use OpenTelemetry 🙂.
If you want to migrate from OpenTracing to OpenTelemetry, an official guide exists.
Jaeger

Jaeger is an open-source distributed tracing platform.
It can be used for monitoring microservices-based distributed systems:
- Distributed context propagation
- Distributed transaction monitoring
- Root cause analysis
- Service dependency analysis
- Performance / latency optimization
Jaeger contains several components:
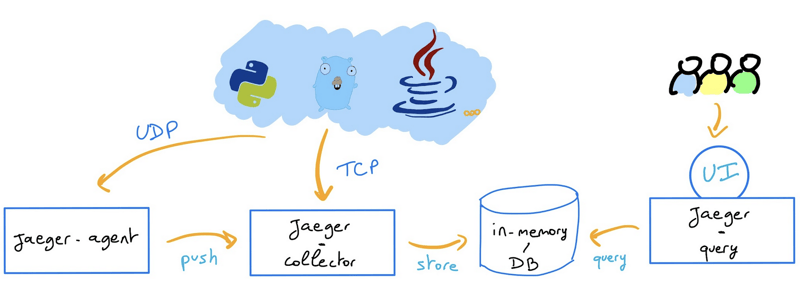
Run Jaeger locally
We will use Docker to run the Jaeger UI, collector, query, and agent, with an in memory storage component:
$ docker run -d --name jaeger \
  -e COLLECTOR_ZIPKIN_HTTP_PORT=9411 \
  -p 5775:5775/udp \
  -p 6831:6831/udp \
  -p 6832:6832/udp \
  -p 5778:5778 \
  -p 16686:16686 \
  -p 14268:14268 \
  -p 9411:9411 \
  jaegertracing/all-in-one:1.6
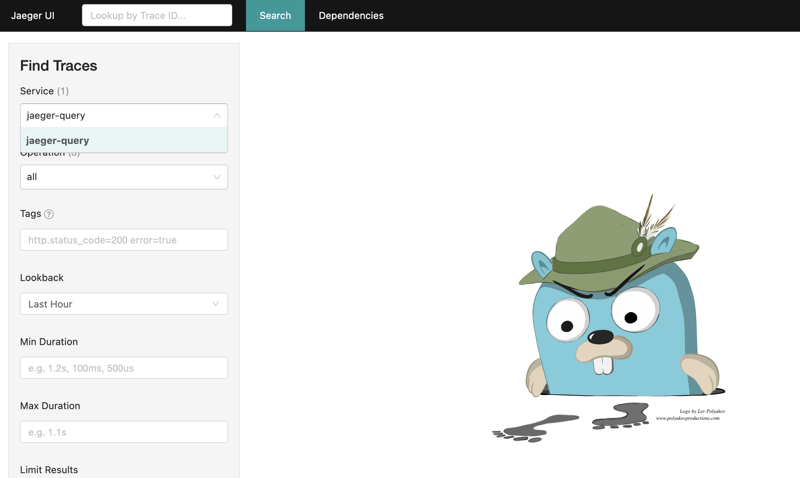
The Jaeger UI will be available on port 16686 and you will send traces to port 14268.
Open your browser, enter the URL http://localhost:16686 to display the Jaeger UI:
Initialization
We created our Git repository in a previous article, so now we just have to retrieve it locally:
$ git clone https://github.com/scraly/learning-go-by-examples.git
$ cd learning-go-by-examples
We will create a folder go-gopher-opentelemetry for our CLI application and go into it:
$ mkdir go-gopher-opentelemetry
$ cd go-gopher-opentelemetry
Now, we have to initialize Go modules (dependency management):
$ go mod init github.com/scraly/learning-go-by-examples/go-gopher-opentelemetry
go: creating new go.mod: module github.com/scraly/learning-go-by-examples/go-gopher-opentelemetry
This will create a go.mod file like this:
module github.com/scraly/learning-go-by-examples/go-gopher-opentelemetry

go 1.19
Before to start our super instrumented application, as good practices, we will create a simple code organization.
Create the following folders organization:
.
├── README.md
├── bin
└── go.mod
That's it? Yes, the rest of our code organization will be created shortly ;-).
Create our application
OpenTelemetry is split into two parts: an API to instrument code with, and SDKs that implement the API.
Let's install OpenTelemetry Trace API in order to use it in our code:
$ go get go.opentelemetry.io/contrib/instrumentation/net/http/otelhttp
$ go get go.opentelemetry.io/otel/exporters/jaeger
$ go get go.opentelemetry.io/otel/sdk/resource
$ go get go.opentelemetry.io/otel/sdk/trace
Good, now we can create a main.go file and copy/paste the following code into it.
Go code is organized into packages. So, first, we initialize the package, called main, and all dependencies/librairies we need to import and use in our main file:
package main

import (
    "context"
    "fmt"
    "log"
    "net/http"
    "os"
    "time"

    "go.opentelemetry.io/contrib/instrumentation/net/http/otelhttp"
    "go.opentelemetry.io/otel"
    "go.opentelemetry.io/otel/attribute"
    "go.opentelemetry.io/otel/exporters/jaeger"
    "go.opentelemetry.io/otel/sdk/resource"
    tracesdk "go.opentelemetry.io/otel/sdk/trace"
    semconv "go.opentelemetry.io/otel/semconv/v1.7.0"
)
With the imports added, you can start instrumenting.
The OpenTelemetry Tracing API provides a Tracer to create traces. These Tracers are designed to be associated with one instrumentation library. To uniquely identify an application to the Tracer we will use create a constant with the package name in main.go file.
So, we define const:
const (
    service     = "go-gopher-opentelemetry"
    environment = "development"
    id          = 1
)
Then, we create a function called tracerProvider() that initiates a connection to a tracer provider, a Jaeger instance for example.
func tracerProvider(url string) (*tracesdk.TracerProvider, error) {
    // Create the Jaeger exporter
    exp, err := jaeger.New(jaeger.WithCollectorEndpoint(jaeger.WithEndpoint(url)))
    if err != nil {
        return nil, err
    }
    tp := tracesdk.NewTracerProvider(
        // Always be sure to batch in production.
        tracesdk.WithBatcher(exp),
        // Record information about this application in a Resource.
        tracesdk.WithResource(resource.NewWithAttributes(
            semconv.SchemaURL,
            semconv.ServiceNameKey.String(service),
            attribute.String("environment", environment),
            attribute.Int64("ID", id),
        )),
    )
    return tp, nil
}
And the main() function that:
- connects to the Jaeger collector you previously deployed
- create a HTTP server that listening on port
8080 - and creates and sends a span each time the / HTTP route will be called:
func main() {

    // Tracer
    tp, err := tracerProvider("http://localhost:14268/api/traces")
    if err != nil {
        log.Fatal(err)
    }

    // Register our TracerProvider as the global so any imported
    // instrumentation in the future will default to using it.
    otel.SetTracerProvider(tp)

    ctx, cancel := context.WithCancel(context.Background())
    defer cancel()

    // Cleanly shutdown and flush telemetry when the application exits.
    defer func(ctx context.Context) {
        // Do not make the application hang when it is shutdown.
        ctx, cancel = context.WithTimeout(ctx, time.Second*5)
        defer cancel()
        if err := tp.Shutdown(ctx); err != nil {
            log.Fatal(err)
        }
    }(ctx)

    tr := tp.Tracer("component-main")

    ctx, span := tr.Start(ctx, "hello")
    defer span.End()

    // HTTP Handlers
    helloHandler := func(w http.ResponseWriter, r *http.Request) {
        // Use the global TracerProvider
        tr := otel.Tracer("hello-handler")
        _, span := tr.Start(ctx, "hello")
        span.SetAttributes(attribute.Key("mykey").String("value"))
        defer span.End()

        yourName := os.Getenv("MY_NAME")
        fmt.Fprintf(w, "Hello %q!", yourName)
    }

    otelHandler := otelhttp.NewHandler(http.HandlerFunc(helloHandler), "Hello")

    http.Handle("/", otelHandler)

    log.Println("Listening on localhost:8080")

    log.Fatal(http.ListenAndServe(":8080", nil))
}
When the HTTP route is called, we print a message with "Hello" and your name that we retrieves in "MY_NAME" environment variable.
Let's test it locally
First, locally, we have to define the environment variable and run your app:
$ export MY_NAME=scraly ; go run main.go
2022/11/08 19:07:54 Listening on localhost:8080
Make a call in our HTTP server:
$ curl localhost:8080
Hello "scraly"!
Let's watch our Jaeger UI again. Cool, a new go-gopher-opentelemetry service appear. Select it and click on Find Traces button:
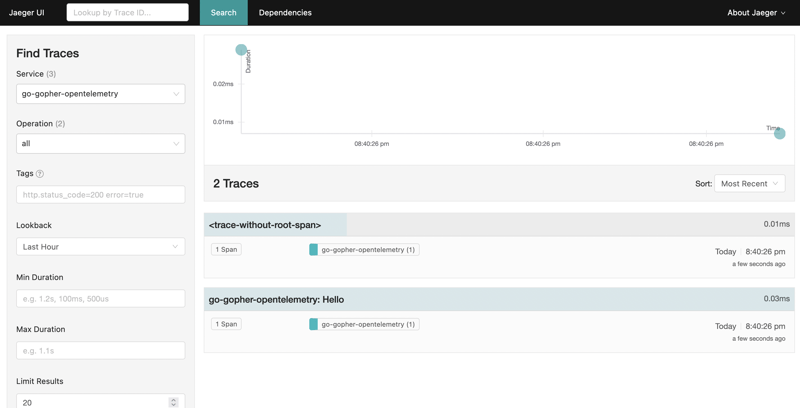
You can now click in a trace and visualize useful information.
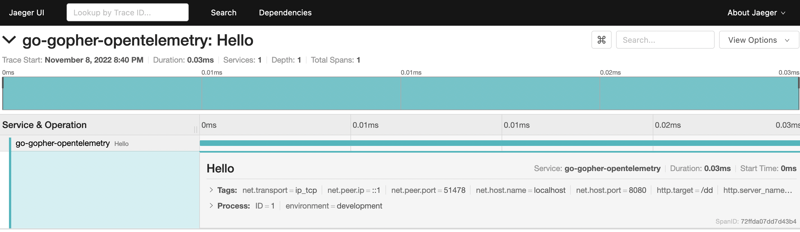
In the trace, you can see the environement and id constants we defined are visible in the trace.
Conclusion
As you have seen in this article and previous articles, it's possible to create applications in Go: CLI, REST API... and also useful apps ready for production with distributed tracing that you can link to other tools.
All the code of our instrumented app is available in: https://github.com/scraly/learning-go-by-examples/tree/main/go-gopher-opentelemetry
In the following articles we will create others kind/types of applications in Go.
Hope you'll like it.


Latest comments (0)