by author Fernando Doglio
When we think about measuring the performance of our applications we tend to drift towards the backend environment. We picture metrics such as resource utilization, disk I/O operations, memory leak detection, response times, and more.
However, given the complexity of today’s web interactions it’s not that crazy to think that we also need to understand how to focus our performance measuring efforts on the UI.
But how can we do that? Browsers don’t really perform I/O operations on the client disk, can we somehow measure memory utilization? What else can we analyze?
While it is true that if you want to be extremely detailed you'll want to come up with a custom list of metrics, one specific for your context. Here I list the top 5 metrics to consider when measuring UI performance in general.
Time To Interactive (TTI)
This metric allows you to understand how long it takes your users to be able to interact with your application. One thing is to have it rendered and a very different one is to have it be interactive.
This metric depends on a couple of things:
- That the layout is stable. Everything visible has already been loaded.
- That the CPI main thread is free. If you're still loading scripts or processing something then your application will not be interactive. User clicks and other actions will be ignored (or queued) until the thread is freed.
This is becoming a very relevant metric to track because it directly affects the User Experience (UX) of your application. It’s not just about cold numbers, but rather about the way your users experience your UI. And while that might sound like a very subjective thing to measure, through the use of some metrics such as TTI we can start getting closer to that.
Measuring TTI
The fastest and easiest way to calculate the TTI of your website, is to use Lighthouse on Google DevTools.
As part of the generated report by Lighthouse you have the TTI number:

Improving your TTI
One key way to improve your TTI is to reduce the load time for your scripts.
Script processing and loading time will be the main culprit of a high TTI, so consider the following:
- Remove unused scripts, anything that the browser needs to interpret and is not used, then it’s just stealing seconds from your loading time.
- Split your scripts up into multiple, smaller files. This also helps the browser optimize the way those scripts are loaded and interpreted.
- Dynamically load scripts, especially those that come from external resources and you can’t really split or change in any way.
Notice however that the main thread will only be considered “reliably interactive” once it’s free of tasks that last longer than 50 ms for (at least) 5 seconds. This puts a lower limit on the “good enough” value for TTI, 5 seconds or close to it should be more than good enough, and less is considered great.
First Input Delay (FID)
Related to TTI, this metric measures the time it takes your application to respond from the moment the user performs the first input action.
While that sounds an awful lot like TTI, the difference between these two metrics is huge:
- TTI measures the time it takes your app to be ready to start responding to interactions. You don’t need users to measure this, it’s all about making sure the main thread is free and everything’s been loaded. But in the end, it measures the potential time it takes your app to be interactive.
- FID, on the other hand, requires users to measure it, because it tracks the actual time it takes to respond once an interaction’s been performed.
Ideally, you want a low FID, since it would be a sign that your application is very responsive from the start.
How do you measure FID?
Since properly measuring the FID requires real user interaction, you can’t simply scan a website and get that value. However, you can add code to your application to get that information. Once you have, it’s up to you to do whatever you want with it.
Google has an open-source script you can use directly inside your page to measure this metric: https://github.com/GoogleChromeLabs/first-input-delay
Improving your FID times
Improving your First Input Delay time is not trivial since it’s highly coupled with your code's structure and logic. However, Philip Walton from Google came up with a technique called “Idle until Urgent” which tries to maximize the processing time from the main thread without actually locking it.
Essentially it relies on deciding when to load the required resources: either when the browser is idle and has the available processing power or when the resource is indeed, required. It tries to bridge the gap between eager and lazy loading of resources.
Philip's article covers a very detailed implementation on how to implement this concept if you find you need to improve your First Input Delay times.
Total Blocking Time (TBT)
The Total Blocking Time is the length of time during which the page is non-responsive while it loads resources, interprets JavaScript files and does who knows what other tasks in the background.
Essentially, the main thread is so busy handling everything you threw at it that it’s unable to be responsive to the user’s input.
It covers the period from the First Contentful Paint (FCP) up to the TTI.
While TBT might sound very much like another way of describing TTI, they’re not, in fact, they’re quite different.
Consider having the main thread with 4 consecutive tasks of:
- Task 1: 300ms
- Task 2: 55 ms
- Task 3: 45 ms
- Task 4: 50 ms
Like I said above, the first two tasks would be considered “long tasks” because they are over 50ms long. In fact, the “blocking time” would be everything over those initial 50ms, which would yield a total of 255ms of “Total Blocking Time” for 450ms worth of tasks.
With that in mind, how exactly are TBT and TTI different?
Consider 3 51ms tasks spread across 10 seconds, there is no way for the main thread to not have “blocking time” for a period longer than 5 seconds:

The above image shows the given scenario. The Total Blocking Time here is 3 ms while the actual TTI is 15 seconds.
Now, consider what would happen if instead of having 3 micro tasks, you’d have a single task taking 10 seconds. This new scenario would have a TBT of 9950ms (total time over the first 50 ms) however, the TTI would remain the same. The UX wouldn’t be the same though, and that is why you want to minimize the TBT, even if the TTI remains constant.
Measuring the TBT
The Total Blocking Time can be measured using Lighthouse on Google Chrome like the TTI. In fact, if you generate the report, you’ll see it right under TTI.

Improving the TBT
Many factors can affect the TBT so a good rule of thumb, is to pay attention to the suggestions generated by Lighthouse at the bottom of its report. Some of them will help you lower your numbers.
In general, a TBT of 300ms or lower is considered good enough, so if you’re sitting there, don’t worry about it for the time being.
But if you’re having bad numbers, like on my screenshot above, you might want to consider following this guide, where you can see how to go deep into determining the cause of the long tasks blocking your main thread. Remember, first you need to figure out which tasks are lasting longer than 50 ms and start tackling the slower ones. There is no generic sure-fire way of solving slow TBT, it’ll take time and patience, but it can be done.
Cumulative Layout Shift (CLS)
In other words, how much is your layout moving around while everything loads. If your layout isn’t structured correctly, slow-loading images or fonts (just to name two examples) can cause elements to move (or shift) around before the user even gets a chance to interact with them. Or what’s even worse, while it is interacting with the elements an image loads and suddenly your “Cancel” button is nowhere to be seen and your “Buy now” button is right where the other one was.
A high CLS essentially yields a terrible UX, so you want to try and lower this number as much as possible.
Measuring the CLS of your website
The default report from Lighthouse already provides you with a good idea of what is your CLS index.

You can find it right under the TBT value.
If on the other hand, you want to incorporate this value into a custom report or you want more control over how it gets calculated, you can take advantage of the Layout Instability API which gives you everything you need to measure how elements shift around on your webpage. This alternative gives you full control over the calculation and what to do with it, however, notice that it’s not a straightforward formula and that it requires lots of consideration (such as what happens with iFrames and pages on the background).
So instead, if you're looking for a custom alternative you can check out Google’s WebVitals API which provides a very handy getCLS method.
Improving your CLS
CLS happens due to unexpected changes in the layout, so consider the following guidelines when writing your HTML and CSS:
- Do not insert elements on top of others causing layout shifts. This normally happens when inserting sudden notification or alert boxes. Try to use other alternatives that don’t affect the position of other elements on the page.
- Always add size attributes to your images and video elements. That way the browser knows how to reserve the proper place for them before they even load.
- Avoid animations that cause layout changes. Some transitions look great and don’t require anything to move, so consider using them instead of shifting elements, or changing sizes affecting the layout, even if it’s just for a few frames.
Measuring front-end performance
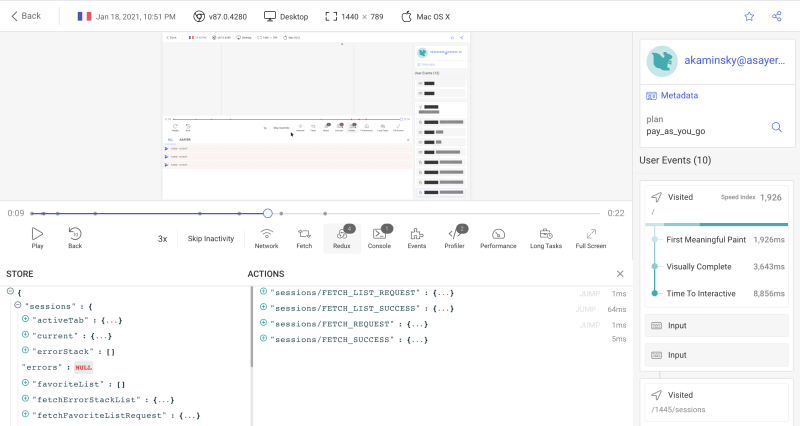
Monitoring the performance of a web application in production may be challenging and time-consuming. Asayer is a frontend monitoring tool that replays everything your users do and shows how your app behaves for every issue. It’s like having your browser’s inspector open while looking over your user’s shoulder.
Asayer lets you reproduce issues, aggregate JS errors and monitor your app’s performance. Asayer offers plugins for capturing the state of your Redux or VueX store and for inspecting Fetch requests and GraphQL queries.
Happy debugging, for modern frontend teams - Start monitoring your web app for free.
First Contentful Paint (FCP)
The First Contentful Paint references the time it takes for your page to paint its first non-white element. This is an important metric to understand because the longer it takes for something to render, the longer your user will be looking at a blank page and if that happens for long enough, then they might even consider that your website isn’t working.
This in turn would cause the user to leave looking for an alternative.
Notice however, that this metric references the first piece of content rendered, it doesn’t reference the time it takes the entire page to render, but it’s still very relevant and a metric you should pay close attention to. After all, we’re measuring how fast your user can start visually perceiving your site.
Measuring the FCP
It shouldn’t be a surprise by now that Lighthouse on Google Chrome already provides the means for you to capture this metric. You can see it in the below screenshot:

And just like with other cases, if you need to have more control over the calculation and the data, you can use Paint Timing API.
A good FCP is considered to be between 1 and 3 seconds. If it’s over 3 seconds, then you really need to worry about improving it.
Improving your FCP
Your First Contentful Paint doesn’t just depend on your front-end code, after all, this is one of the first things that happen after you receive the response from your server.
So consider the following ideas when you’re looking to improve your FCP:
- Reduce the Response Times from the Server. This will cause the browser to start processing and interpreting the response much faster. This could be improving your server-side code, or improving how you serve static resources, like moving images to a good quality CDN.
- Consider making the non-critical resources (i.e scripts and css stylesheets) load with
defer:
<script defer src="http://yourcdn.com/your/script/path.js"></script>
Or use this little snippet to load your stylesheets asynchronously:
<link rel="stylesheet" href="style.css" media="print" onload="this.media='all'">
<!-- Fallback for when JavaScript is disabled, but in this case CSS can’t be loaded asynchronously. -->
<noscript><link rel="stylesheet" href="style.css"></noscript>
The snippet loads the Stylesheet with media as “print” which causes the browser to load it asynchronously, however once the page is loaded, it’ll change its media type to “all” (notice the onload attribute). The noscript tag is there in case JS is disabled, because in that case the onload event won’t be triggered.
- Remove unnecessary resources. If you’re not using stylesheets or JS scripts, remove them, they’re actually hindering your FCP times considerably.
- Inline critical styles. This is a questionable one, but if you’re eager to improve your FCP as much as you can inlining some of your CSS will reduce the amount of time required to parse the external resources, instead your browser will parse it much faster.
There are many other ways of improving the FCP, but consider the above suggestions before going deep into other types of optimization.
Conclusions
Measuring UI performance is not a joke nor an easy thing to do. While tools such as Lighthouse provide you with most of the metrics you need to understand if you have a great UI or a terrible one, there are other ways to measure those metrics as well. In fact, if you’re trying to keep track of those numbers and create a custom report around them, there are multiple APIs available for you to capture those numbers yourself.
Remember: there is only one way to understand if you need to optimize the performance of your UI and that is to measure it. Start with these 5 key metrics around UI performance and keep adding others once you’re concluded that you’ve done everything you can around them.


Top comments (0)