
by author Craig Buckler
Poor web page performance has a long-term cost:
- delays frustrate visitors and reduce sales conversions
- users pay more for increased bandwidth requirements
- slow sites are downgraded in Google and other search engine results
- heavier pages increase hosting and maintenance costs
- bloated sites are bad for the environment.
No one wants a slow site but the problem often becomes worse as you add further content, products, and features. The average page now makes 73 requests to download 2MB of data and takes 20 seconds to fully load on a mobile device.
Performance seems less critical when you're developing on a modern device over a fast network. Try using a year-old $100 mobile on a hotel connection and you'll begin to appreciate user dissatisfaction.
Not all bytes are created equally
Images often account for half the page requests and weight. Removing unnecessary images, using an appropriate format, and optimizing to the fewest possible bytes is important. However, images are rarely the primary cause of slow sites:
- Images are not render-blocking. They are downloaded asynchronously and received in any order at any time because no image can depend on another.
- Image download failures are rarely critical. The user may not be aware that a background, hero, or icon is not present.
- Image processing is fast and there's only a small hit when painting pixels to the screen.
Fonts account for around 6% of page download sizes but, like images, they're rarely performance critical and a good font-display strategy can prevent many issues.
Video is a major bandwidth-sapping asset but many hosting platforms optimise bit rates according to the device/network. You should avoid auto-playing videos but newer browsers often block such activities.
The average page requires 27KB of HTML. DOM complexity and unnecessary asset loading are an issue, but few sites use significant content. Similarly, CSS requires 73KB but performance problems are rare unless the server response is slow or your design requires thousands expensive properties such as border-radius, box-shadow, or filter.
Which leaves JavaScript. At 450KB in 21 requests, it's not the largest asset but can cause the biggest performance hit:
- Scripts must be downloaded. A request can be directed to a Content Delivery Network (CDN) but this incurs an additional DNS lookup; the response is not always faster than your own server.
- JavaScript code must be parsed and executed. Processing alone typically uses 10-30% of the page load time. A mid-range mobile can take 4x longer to execute than a high-end device.
- JavaScript is render-blocking. Scripts can do anything: change the DOM, jump to another page, inject other file, etc. Browsers run on a single processing thread so it's not possible to undertake other rendering activities until a script completes execution.
Render-blocking can be prevented by using:
- a
deferattribute on the<script>tag or adopting ES modules withtype="module". This forces scripts to load in the background and run in order shortly before the HTML DOMContentLoaded event. - an
asyncattribute. Scripts load in parallel and execute as soon as they are ready. Execution can occur in any order so they should not depend on other scripts (unless those are loaded withoutasyncordeferset).
Problems are exacerbated by third-party JavaScript typically used for advertising, analytics video embeds, chat widgets, social sharing buttons, etc. An innocuous <script> tag can spawn a cascade of further requests with their own performance, security, and privacy implications. Many services recommend scripts are loaded in the HTML <head> so your page will only be as fast as the slowest response.
The following sections describe browser tools to help assess your JavaScript performance issues. The easiest tools are explained first but later options provide more in-depth analysis.
Use the browser task manager
Most browsers have a built-in task manager showing metrics for each process. Select Task Manager from the More tools menu in Chrome-based browsers or More menu in Firefox:

There will be an entry for each open tab and internal browser activity. Ensure your site is in the active tab then check the ongoing CPU and memory usage to determine which pages or features require significant JavaScript processing.
Disable JavaScript
Disabling JavaScript is not possible for sites that use client-side frameworks but is an option for content sites such as those powered by WordPress.
Navigate to a page you want to test then open DevTools with F12 or Ctrl | Cmd + Shift + I and click the Network panel. Check Disable cache then refresh and wait for the page to load. Examine the status bar metrics:
![]()
Refresh the page a few times to get a general idea about:
-
requests: the number of HTTP requests -
transferred: the volume of (compressed) data downloaded -
resources: the total volume of all uncompressed data -
Finish: the total time for all requests and processing to complete -
DOMContentLoaded: the time taken for the HTML DOM to finish loading, and -
Load: the time taken for the page and all assets to finish loading.
Now click the DevTools Settings cog icon or press F1 and check the Disable JavaScript option:

Return to the Network panel, refresh the page again, and note the metric changes:
![]()
The differential is often dramatic on JavaScript-heavy sites.
Analyse network performance
The Network panel shows how each asset is downloaded and parsed in a waterfall chart:

The bar highlights the following metrics -- you can click an asset to open the Timing tab for more information:
- stalled or blocked: a request is queued but held up. This typically occurs when a render-blocking stylesheet or script is loading or executing
- DNS resolution (if available): the time taken to locate the domain where the asset is hosted. This is rarely a problem unless you are making many calls to third-party domains
- request sent or connecting, TLS setup, and sending: the time taken to make the initial request
- Waiting or Time to First Byte (TTFB): the elapsed time between the request being sent and the first data arriving back. Long waits often suggest an overloaded server.
- Content Download or Receiving: the time taken to receive the full payload. A long wait could indicate a large asset or busy server.
Ensure you are accurately emulating a first-time user by checking Disable cache and setting a slower network Throttling option.
Filter and block network requests
The Network panel offers several filters including a JS button to only show JavaScript requests.
The search box can find requests which match part of a URL, but you can also filter all third-party assets by entering: -domain:<yourdomain>. Wildcard characters such as *.domain.com ensures all your sub-domains are excluded.
If you have concerns about a particular script, you can block it by right-clicking and choosing:
- Block request URL to block an individual script, or
- Block request domain (if available) to block all assets from a specific domain.
A blocking panel appears which allows you to enable, disable, edit, or delete filters. It also shows how many assets have been blocked, although this may not be accurate if a blocked file is responsible for downloading many other assets.

Use Chrome's Performance Monitor
Chrome-based browsers offer a real-time Performance Monitor from the DevTools More tools menu:

Metrics are displayed or hidden by clicking their heading:
| Metric | Description |
|---|---|
| CPU usage | processor utilization from 0% to 100% |
| JS heap size | memory required for JavaScript objects |
| DOM Nodes | the number of elements in the HTML document |
| JS event listeners | the number of registered JavaScript event listeners |
| Documents | the number of document resources including the page, CSS, JS, etc. |
| Document Frames | the number of frames, iframes, and worker scripts |
| Layouts / sec | the rate at which the browser has to re-layout the DOM |
| Style recalcs / sec | the rate at which the browser has to recalculate styles |
The CPU usage, JS heap size, and JS event listeners are useful for assessing JavaScript performance. The Layouts and Style recalcs will highlight the impact of any DOM changes made by your scripts.
Use Chrome Lighthouse
Google's Lighthouse tool can assess your page for performance, best practices, accessibility, search engine optimization, and use of Progressive Web App technologies on both mobile and desktop devices. Access the Lighthouse panel in DevTools, select the options you want to test, and hit Generate report:

The report may take a few minutes to generate. Each metric is given a score out of 100 with further information and advice in the sections below:

The Performance section provides a range of statistics including:
- First Contentful Paint (FCP): the time at which the first text or image is rendered
- Speed Index: how quickly contents are visibly populated
- Largest Contentful Paint (LCP): the time at which the largest text or image area is painted
- Time to Interactive (TTI): the time for the page to become fully interactive
- Total Blocking Time: the sum of processing periods between FCP and TTI which exceed 50ms
- Cumulative Layout Shift (CLS): a measure of layout movement as the page loads.
The section is followed by several dozen metrics with links to further information pages.
Find unused JavaScript
Chrome's Coverage panel allows you to find JavaScript (and CSS) code that could potentially be removed to reduce file sizes and improve performance. Select Coverage from the More tools menu in DevTools then reload the page:

The panel shows the percentage of unused code in a bar chart. Click any JavaScript file to view unused code highlighted with a red bar in the line number gutter.
You can test Single Page Apps by navigating around and using features to update the unused code indicators. However, be aware:
- Coverage information is reset when you reload or navigate to a new page.
- Unused code could be required by another browser or an untested feature.
The coverage tool helps locate removal candidates, but a script bundler which includes tree shaking to remove dead code is a more reliable option.
Check client-side storage
Web pages can store data on the client using a variety of techniques. The Application panel in Chrome DevTools (or Storage panel in Firefox) allows you to add, examine, modify, and delete values held in cookies, cache storage, localStorage, sessionStorage, IndexedDB, and Web SQL (where supported).

With regard to performance:
- Up to 20 4Kb cookies can be allocated per domain. Up to 80KB could be added to every HTTP request and response from that domain so reducing cookie data should improve performance.
- Around 5MB of data can used in localStorage and sessionStorage. It is retained on the client but the API is synchronous and blocks other processes while data is written or read. This could cause a performance issue if your site makes repeated calls during normal operation.
- Limits are higher for IndexDB, Cache, and File APIs so there can be a performance hit when attempting to locate a particular item from a large store.
The Storage tab in Chrome shows how much data is stored locally and provides a Clear site data option.
Run a performance report
The DevTools Performance panel allows you to record a sequence of page activities for analysis. It should help identify which functions are causing performance bottlenecks.
The panel's settings icon allows you to set various options such as slowing down the network and CPU. You can also disable JavaScript samples so detailed call stacks are not recorded:

Once you're ready, start recording by clicking either:
- the circular Record icon on the far left, or
- the Record and reload page icon next to it.
Switch back to the site tab and perform any activities you want to analyze. Keep this to a minimum so performance analysis is easier.
Hit the Stop button or the Record icon again to stop recording. A daunting set of charts are statistics will appear:

At this point, you can save the profile using the down icon so it can be reloaded later or sent to others for further analysis.
The top bar shows a timeline:

where:
- the top red bar indicates the frame rate has dropped to a low point and could be causing performance issues (it will be red at the start of a page load).
- the green bar shows the number of frames per second (FPS). The higher the bar, the closer it is to a good response rate of 60fps.
- the CPU bar appears next. Each color identifies an activity in the Summary pie chart at the bottom of the report (JavaScript is shown in yellow). Performance could be poor if CPU activity remains high for long periods.
- the last blue line shows periods of network activity.
Click and drag an area of the timeline to select a period to analyze. The scrubber controls can be moved to adjust it accordingly.
The sections below the timeline provide a number of expandable and collapsible metrics:

Useful information includes:
- Network: loading times for each asset, where HTML files are shown in blue, CSS in purple, JavaScript in yellow, and images in green
- Frames: the time between frames. Red bars indicate delays which lower the rate below 60fps
- Interactions: input and animation timings
-
Timings: events such as
DOMContentLoaded,onLoad, FCP, and LCP - Main: activities such as function calls and event handlers.
The Main panel shows a flame chart where a task is split into sub-tasks with function calls, event handlers, and browser rendering processes. Click any item to open the Call Tree tab which highlights which root activities caused the most work:

The bottom pane also shows:
- Bottom-Up: activities which took the most time
- Event Log: activities in the order they occurred, and
- Summary: a breakdown of timing metrics for the selected period:

Analyse memory usage
Memory is possibly the most technical and least-used DevTools panel. It can help visualize usage over time and identify leaks where unused memory cannot be garbage collected effectively. Common memory leak causes include:
- Accidentally defining a global variable.
- Closures where an inner function prevents garbage collection of a variable in the outer scope.
- Redundant timers or event listeners.
- Cyclical callbacks, e.g. functionA is set as a callback when functionB ends, but functionA then calls functionB again.
- Detached DOM nodes which are removed from the document but a reference still exists in JavaScript.
Rising memory can often be spotted in the task manager, performance monitor, or performance report. The Memory panel also shows a live indicator with green and red figures as usage falls or increases accordingly:

Measuring front-end performance
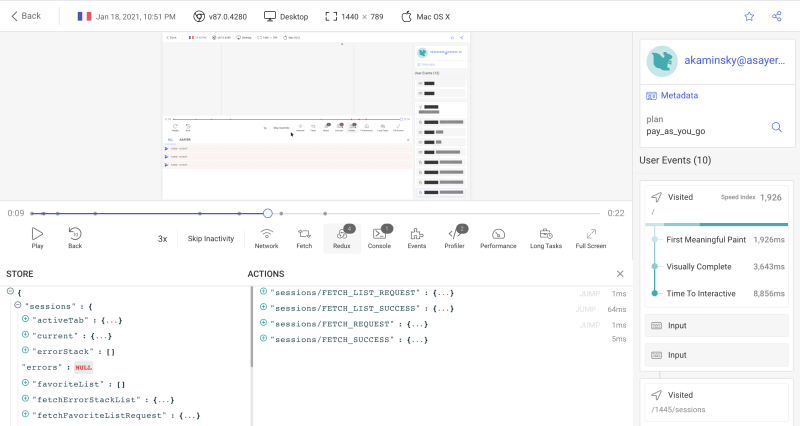
Monitoring the performance of a web application in production may be challenging and time-consuming. Asayer is a frontend monitoring tool that replays everything your users do and shows how your app behaves for every issue. It’s like having your browser’s inspector open while looking over your user’s shoulder.
Asayer lets you reproduce issues, aggregate JS errors and monitor your app’s performance. Asayer offers plugins for capturing the state of your Redux or VueX store and for inspecting Fetch requests and GraphQL queries.
Happy debugging, for modern frontend teams - Start monitoring your web app for free.
Heap snapshots
A heap snapshot records the size of all JavaScript objects in memory. To generate it, make sure Heap snapshot is selected and click Take snapshot. A list of objects is returned in the Summary view:

where:
- Constructor is the function used to define the object. Many of these will be internal to the browser itself.
- Distance is the distance from the root. The greater the distance, the longer it takes to load and process that object
- Shallow Size: the memory used by the object itself
- Retained Size: the memory which can be freed when the object is deleted.
Clicking any object shows its child objects in the lower panel.
The Summary select field can also be changed to:
- Containment view which allows you to explore heap content, and
- Statistics view which shows a pie chart of object types.
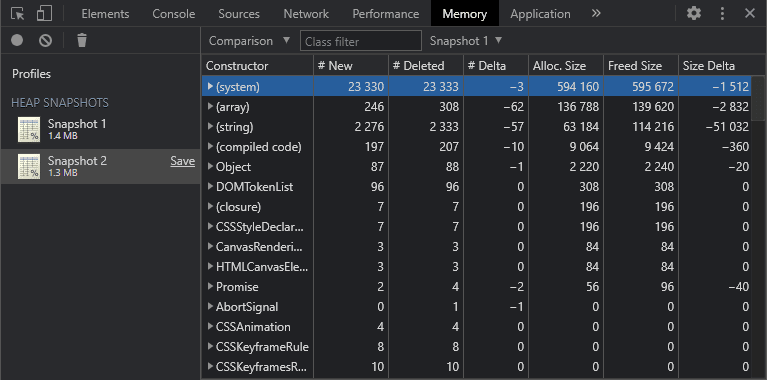
A single snapshot is not particularly useful. Click Profiles then record another snapshot. Change the Summary dropdown to Comparison and make sure the first snapshot is selected:
Other fields are now shown:
- #New: how many new objects have been created
- #Deleted: how many objects have been deleted
- #Delta: the change in object numbers
- Alloc. Size: the memory allocated
- Freed Size: how much memory was freed
- Size Delta: the change in free memory
Any large positive changes in the size delta could indicate a memory leak.
Allocation instrumentation on timeline
The Memory panel's Allocation instrumentation on timeline option allows you to record memory activities in a similar way to the performance monitor:

You can focus on any area of the timeline where memory allocation is unusually high and investigate which objects are causing the spike.
Allocation sampling
The Memory panel's Allocation sampling option can record memory usage over long periods then report which objects are using the most resources:

Use the Performance API
The Performance API provides a number of methods to help profile JavaScript execution by logging messages to the console or recording to another system via Ajax or perhaps Analytics events.
performance.now() returns the elapsed time in milliseconds since the page loaded. Unlike Date.now(), it returns a floating-point number representing fractions of a millisecond:
let t0 = performance.now();
doSomething();
let t1 = performance.now();

console.log(`doSomething() executed in ${ t1 - t0 }ms`);
A similar option is performance.mark() which records a named timestamp, e.g.
performance.mark('appstart');
performance.mark('init');
performance.mark('render');
Each command creates a PerformanceMark object with name and startTime properties which is added to an internal array. The mark can be cleared with performance.clearMarks() -- pass an individual mark name or no argument to clear all marks.
The time between two marks is calculated by creating a named PerformanceEntry object with performance.measure(<measurename>, <startmark>, <endmark>) e.g
performance.measure('initialization', 'appstart', 'render');
PerformanceEntry objects have name, startTime , and duration properties.
Marks and measures are accessed with:
-
performance.getEntriesByType(type)where type is either "mark" or "measure" -
performance.getEntriesByName(name)where name is a mark or measure, and -
performance.getEntries()to access all items.
The name and duration of every measure can be output:
performance.getEntriesByType('measure')
  .forEach(m => console.log(`${ m.name }: ${ m.duration }ms`));
Similar APIs exist for timing:
- navigation events: the time required to unload the current page and load a new one
- resource events: the time required to load specific assets.
Pinpointing performance problems
The number of DevTools options can be overwhelming with confusing terminology and complex results. Invest a little time in using the panels and it'll become easier to locate JavaScript bottlenecks. Fixing those issues is another matter, of course!


Top comments (1)
A very comprehensive article on how to identify JavaScript performance issues, but not on fixing them, maybe adjust the title slightly as the information here is invaluable when debugging but I was a little "miffed" when I got to the end and there were no fixes 😋