This is my first article here. In this article, I share some tips that I wish I had known sooner. Those tips help you to debug faster and/or code better.
Most of the features I show here are available in all browsers.
The most important feature to me is 7 - Lighthouse and if you work with a dedicated test team, 8 - Export the Network tab is vital !
1 - Put any DOM element in a variable
The Elements tab allows you to edit the DOM and CSS properties.
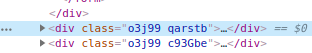
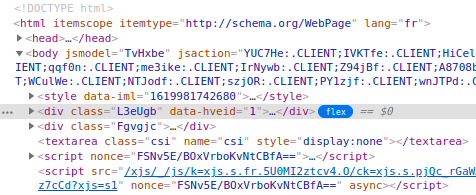
But did you know that clicking on an element of the DOM will also put this element in the variable $0 ? Chrome actually gives an hint about that by adding == $0 beside the selected element :
You can then manipulate it in JavaScript from the Console tab :
![]()
Also, if you select other elements, $1 will contain the previously selected element. $2, $3 and $4 work in the same way.
2 - Pretty print minified source files
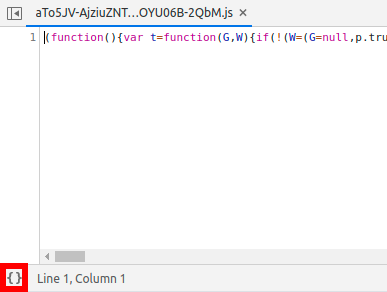
In the Sources tab now, suppose that you are working with minified code and need to put a breakpoint somewhere in this file :

This script is minified so the whole script lies in a unique line. How to put a breakpoint if there is only one line ? This is where the Pretty print tool comes in. It is located in the lower left corner :
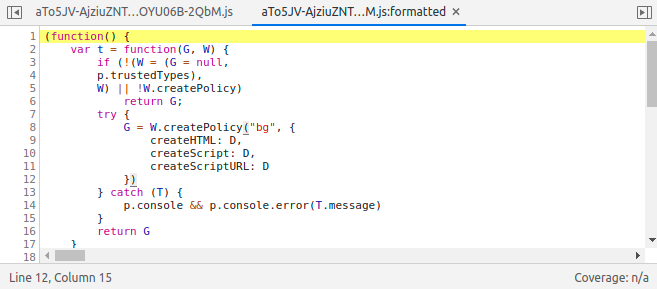
Click it and... tadaaa !
3 - Conditional breakpoints
Speaking about breakpoints : what if there is a function that is called very often and throws an error only when a particular value is given ? How do you debug it without clicking 100 times on "Step over" ?
You can add a condition or a bunch of use Conditional breakpoints !console.log
First, you need... a breakpoint !
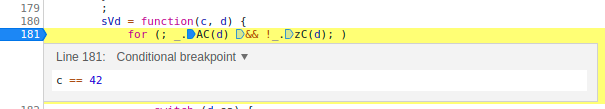
Click in the left column on the line of your choice to add a breakpoint then right click on the blue arrow then Edit breakpoint :
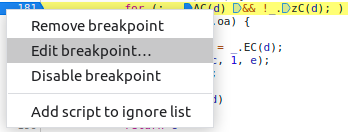
You can now write any condition you want. The code execution will stop only when the condition returns true
4 - Preserve logs upon navigation
Tired of losing logs each time you navigate ? You can just tell Chrome to keep them. The cog icon located in the upper right corner offers a ton of useful options.

In the Network section, you can tick Preserve logs.
In the Console section, you can tick Preserve log upon navigation.
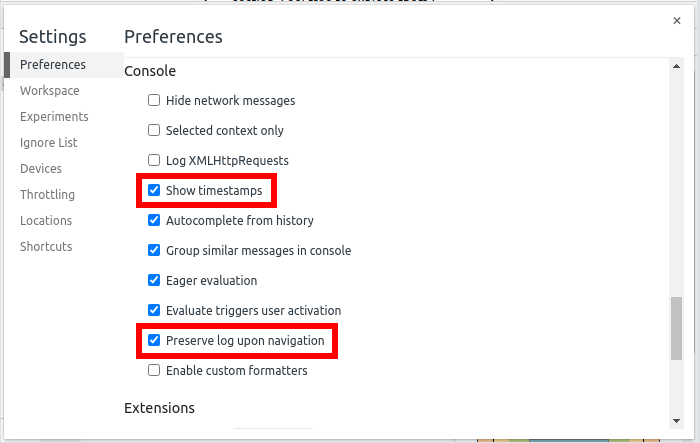
There are a lot of other useful options, such as Show timestamps in the Console section. Feel free to explore them !
5 - Simulate a slow connection
Not everyone has a good internet connection. Do you know how long does it take to display your site on a slow connection ?
In the Network tab, there is an option to simulate a slow connection :
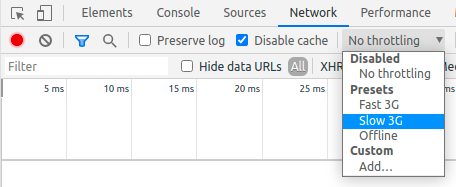
Do not forget to tick the Disable cache checkbox if you want to simulate a first connection.
6 - Replay a request
Suppose that there is a request that ends in error in your application. In order to understand why, you would like to be able to replay this request and/or modify its content.
In the Network tab, you can right-click on a request and there are several options :
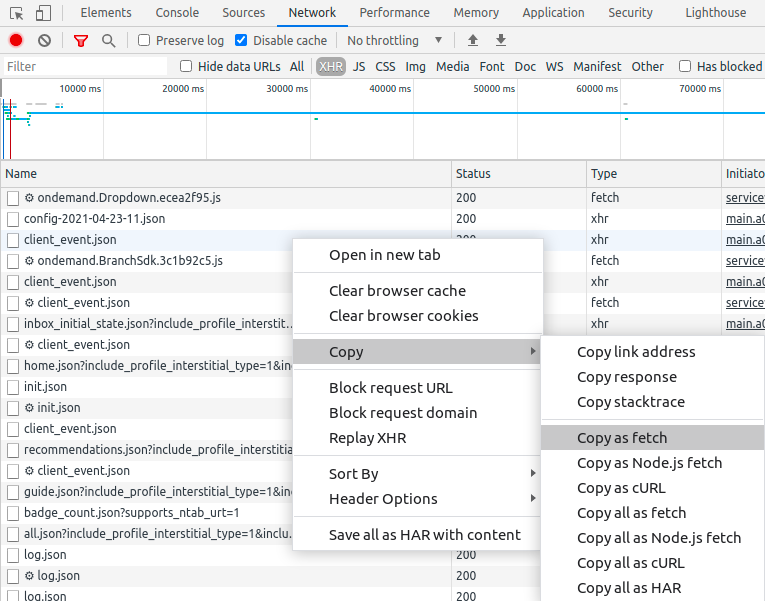
If the error came form the server, you will appreciate the Replay XHR for a quick retry after fixing the problem.
You can also copy it to any format and modify it before replaying it. The easiest one is Copy as Fetch : it will generate the code to reproduce the request and copy it to the clipboard, you can then paste it in the Console tab :
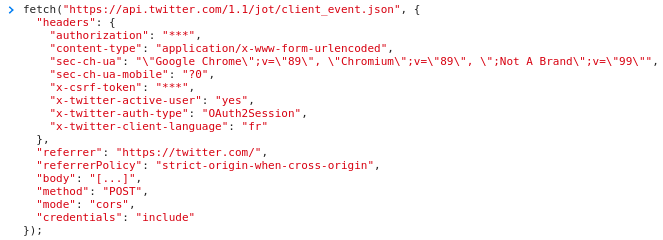
Now, you can modify any parameters you want and see if the problem still occurs.
7 - Lighthouse
The most important one in my humble opinion ! The Lighthouse tab offers a free audit of your website.
As simple as can be, just click on the Generate report button.
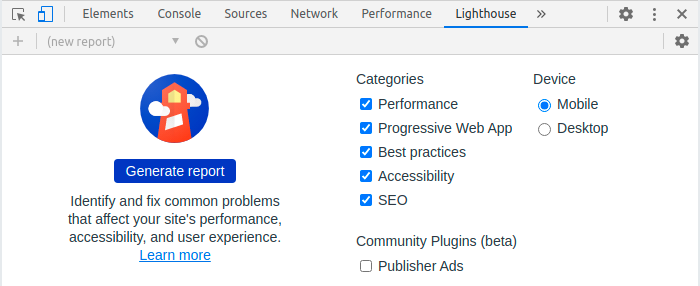
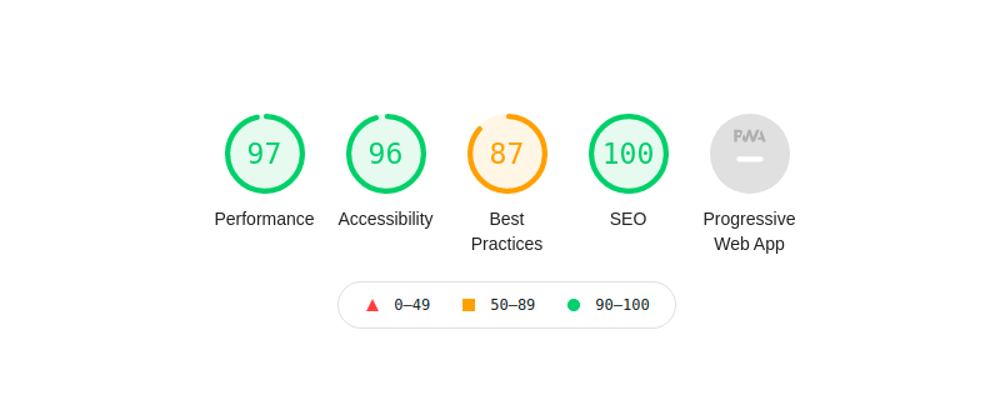
Lighthouse will run a battery of tests concerning performance, accessibility, best practices, SEO and progressive webapps.
First, it will give you some marks for each category :
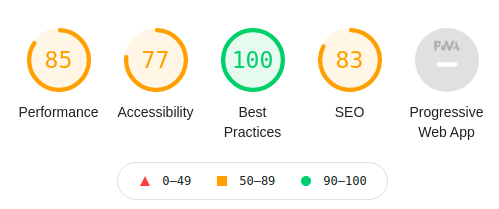
This is neat because it will make you want to get a 100%.
But more important, it gives detailed advices on every detected problem :
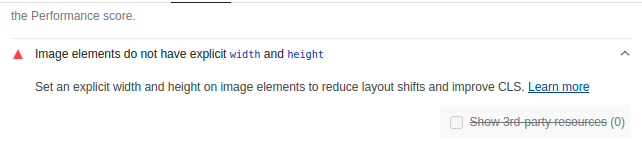
Here, it is advised to set explicit width and height attributes on images. The Learn more link gives a detailed explanation on why it is important and how to fix it.
Tip : if you have problems with your images' weight, take a look at Squoosh!
8 - Export the Network tab
This one is essential if you are working with a dedicated test team. Suppose that a tester filed a bug report but you do not understand what the tester actually did.
You probably already know that the Network tab allows you to see the executed requests with all the details concerning :
- Requested URL
- The request method (
GET,POST,PUT,DELETEetc) - Request headers
- Request body
- Response headers
- Status code And so on
But did you know that you could export/import the content of this tab ?
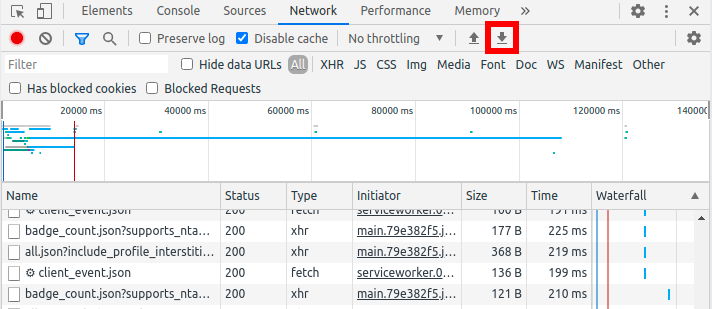
Click the export button and you will get an HAR file.
You can then later reimport this file using the Import icon located just next to the Export icon (or drag the HAR file in the Request tab directly, which is even cooler). You then have a complete trace of what the tester did along with all the request details.
9 - New : the Flexbox debugging tool !
Note : this feature is recent and things are still changing. Even the Official documentation might not be up to date
As it is a quite recent feature, you might have to activate it in the Experiments sections of Chrome settings.
Open Chrome settings :
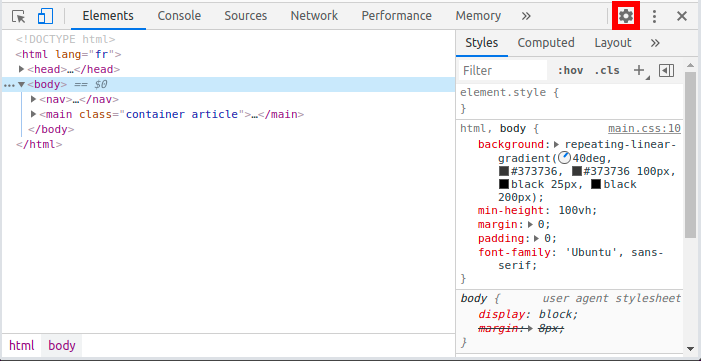
Then, in the Experiments section, check Enable new CSS Flexbox debugging features (you might need to scroll down to find it) :
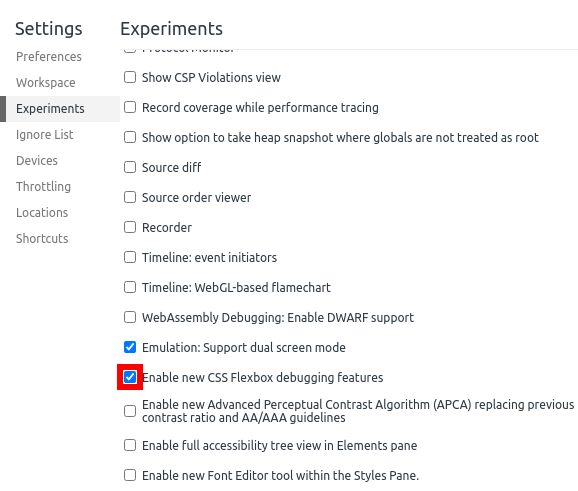
You might get a warning message with a button to reload DevTools
Now, in the Elements tab, every DOM element that has display value of flex, inline-flex or grid, you can see a flex or grid badge. Click on it to toggle the display of an overlay on the page.
You can try it on Google !
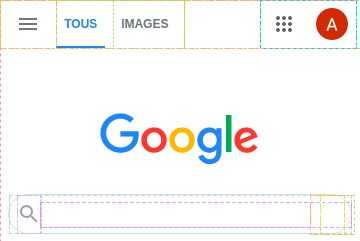
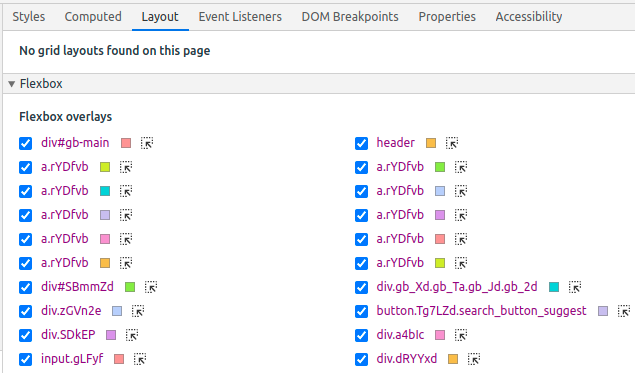
An overlay appears, showing the position of the elements. Also, in the Elements tab, there is a Layout tab that has now a Flexbox section where you can activate/deactivate the overlay each element :
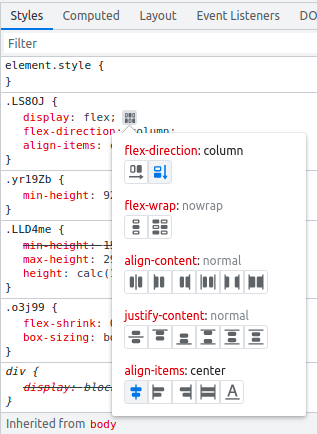
Also, a panel appears in the Style tab. This panel allows you to quickly try different display options :
Conclusion
Chrome DevTools contains dozens of useful features but I decided to show only the ones I use the most.
I hope those tips will make your debugging sessions easier and help you becoming a better developer.
You can follow me on Twitter in order to know when future articles come. Also, tell me which feature helped you the most !


Top comments (0)