Mapbox GL JS is one of the nicest open-source JavaScript libraries for displaying maps. It’s my favorite alternative to Google’s service and in this article I’ll tell you why. I will also give you a quick introduction to setting up Mapbox.
Intro
One of the personal projects I’m working on is a webapp to beautifully showcase travels and destinations. I had this idea in my head since I came back from a long trip and after doing Peter Tichy’s React course that included making a map based application, I was inspired. The app is React based and I might combine it with Gatsby but before I got started I had to learn a thing or two about maps.
The concept I visualized was filled with smooth panning, zooming and flying to animated markers and such. I began developing with Google maps but quickly ran into limitations with things like handling of markers and zooming around. As it’s been a while ago I’m not sure what these limitations were exactly, but I do remember spending many hours figuring things out that eventually didn’t work as well as I hoped. So I started looking for an alternative.
Enter Mapbox GL JS. Mapbox GL JS is an open-source JavaScript library for displaying vector tile based maps. Mapbox GL JS is created by Mapbox, a company offering a whole range of map based services and products including hosted maps and geolocation services. By using webGL and vector tiles, animations seem to work particularly smoothly and they’ve got great API documentation for all their options and functions.
Tiles
One thing I’ve learned is that most online maps consist out of tiles getting loaded on demand. When you go to the Google Maps website and quickly move the map around, you might see a grey glitch here and there. These are tiles being loaded as you enter a new area. There are two specifications for tiles: Vector tiles and raster tiles. As far as I know, vector tiles are the most performant for animations.
Map hosting
Now here’s something I never gave much thought to: Maps need to be hosted somewhere, and hosting isn’t free! Google Maps offers a very generous personal limit, but their maps data isn’t accessible outside of the Google ecosystem. There are a few options to get you set-up without any initial costs though:
Mapbox
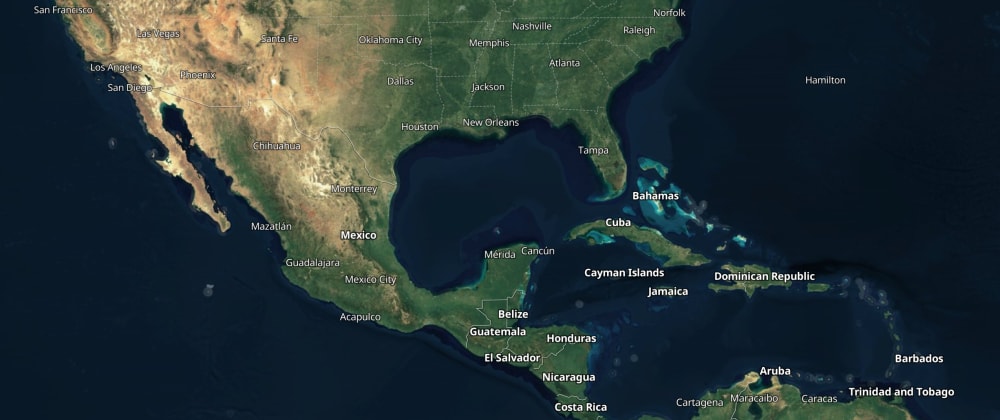
The company behind Mapbox GL JS has a map service with some gorgeous maps (the satellite map is amazing). You also get access to Mapbox Studio allowing you to create custom maps and add all kinds of custom data and data-layers.
The Mapbox service is free up to 50.000 map views a month, which isn’t all that much seeing a map view consists out of loading four tiles and probably comes down to about a 1000 visits. That’s not even unique visits so half of those will be you playing with your own creations because everything is just so damn smooth. After those 1000 visits things get pricey real quickly. In any case, you don’t have to fill in any payment information to get started, so it’s a great service to get you going.
Mapzen
Mapzen offers similar services and limits as Mapbox and they also have some beautiful maps available. I haven’t tried Mapzen yet but I assume loading maps will work similarly as with other services.
Tilehosting.com
Openmaptiles.org used to have a limitless free map hosting for open-source projects but recently started offering their services on tilehosting.com. Open-source / freely available websites can use their free service allowing about 2000 visits a month and has some nice default maps available. They call it a ‘soft limit’ which hopefully means they aren’t too strict. Commercial plans start from $40,- and offer some extra services and premium maps.
Using a tileserver
You can host maptiles yourself using a tileserver. Openmaptiles.org has an open source tileserver available and there are more options out there. This Awesome vector tiles repo seems to have some good resources on the topic. Self hosted maps is one rabbit hole I haven’t gone down yet but in the end might be the only viable option. If I ever get that far I’ll make sure to write an article about it.
Setting up a map
For this write-up I’ll create a map covering some general user-cases:
- Custom markers
- Bound and center the map
- Pan and zoom on click
- Based on JSON data.
Get Mapbox GL JS and a map provider
First of all you’ll need the Mapbox GL JS library. You can find the library on NPM, Github or you can use the CDN provided by Mapbox. You’ll need to include both the script and the stylesheet for a proper display of your map.
Next up you’ll need a map provider. When you use Mapbox, you receive an access token as soon as you’ve signed up. All you need to do is provide the access token and the basic map script and you’ve got yourself a map:
<div id='map' style='width: 400px; height: 300px;'></div>
<script>
mapboxgl.accessToken = ‘token’;
var map = new mapboxgl.Map({
    container: 'map',
    style: 'mapbox://styles/mapbox/streets-v9'
});
</script>
The mapbox styles are selected by using one of their links with mapbox:// as prefix.
In case you use Tilehosting.com, you need to request the data first. With some arrow functions that might look something like this:
// Initialise map with the returned data
const initMap = (mapData) => {
    const map = new mapboxgl.Map({
            container: 'map',
            style: mapData,
            zoom: 8,
            center: [-9.1952226, 38.7436214],
    });
}
// Fetch and return data from the url provided by Tilehosting.com
fetch('https://free.tilehosting.com/styles/darkmatter/style.json?key=yourKeyHere)
.then(response => response.json())
    .then(json => initMap(json));
Don’t forget to style the container div of course. Check out the API documentation for all the possible setup options.
Custom markers
Many default functions within Mapbox GL JS benefit greatly from using the GeoJSON data structure. When using custom markers and the like it doesn’t really matter how your data is structured. In the example below I use some GeoJSON formatted data but as we’re just using the coordinates it doesn’t really matter how your data is formatted, as long as you can loop over it.
Within the initMap function we’ll loop through the data to create a marker for each set of coordinates:
geojson.features.forEach((marker) => {
        const markerEl = document.createElement('div');
        markerEl.innerHTML = '📌';
        new mapboxgl.Marker(markerEl, { offset: [5,-5] })
                .setLngLat(marker.geometry.coordinates)
                .addTo(map);
});
To break it down:
- First we loop through the data with a
forEach. - For each data entry in our list we create a new HTML element. We set the inside of that element with an emoji, but you can use or create anything you want here.
- We use
mapboxgl.markerto add each marker to the map and set the long lat value with the coordinates.setLngLatwill accept either an object or an array. Theoffsetis there offsetting the marker to its true center point.
If we want the map to pan and zoom, Mapbox GL JS has a flyTo function we can utilize on click. Within the forEach loop we can add an event handler to our newly created HTML element
markerEl.addEventListener('click', () => {
            map.flyTo({
                center: marker.geometry.coordinates,
                zoom: 11,
            });
    });
The default flyTo animation is nice, but you can also set your own zoom, speed and curve.
Bound map to markers
Now we’ve got our markers, we want our map to be bound to their coordinates. To do this you can create a lngLatBounds object you can extend with the coordinates of your marker. To do this, assign the object to a new variable:
const bounds = new mapboxgl.LngLatBounds();
Within your marker loop, extend the bounds variable with your coordinates:
bounds.extend(marker.geometry.coordinates);
bounds is now an object with the maximum north-east and south-west coordinates. Next up we’ll write a function to animate the map from its starting position to the new bounds. To do this we’ll use the load event to make sure all the data is loaded:
map.on('load', (e) => {
        map.fitBounds(bounds, {
                padding: { top: 50, bottom: 50, left: 50, right: 50 },
            easing(t) {
                    return t * (2 - t);
            },
        });
});
The fitBounds function takes several options (view the full list here). Right now we only use the padding to make sure none of our markers are too close to the edges.
Result
For the result I cleaned up the code a bit by fitting the markers code and the fitbounds code into separate functions. Feel free to fork this on Codepen!
Mapbox and React
When creating a couple of test maps I also realised, an interactive map with different data layers can get complicated quickly. That’s why I continued my adventure with Mapbox GL JS in React. There are two Mapbox GL React libraries out there: React Mapbox GL and React Map GL by Uber. I’ve tried out the one by Uber but eventually switched to React Mapbox GL because it was a bit more flexible. Mapbox also has some examples of using React with Mapbox GL JS available: https://github.com/mapbox/mapbox-react-examples.
Conclusion
The Mapbox GL JS API is insanely versatile and includes a huge range of events and options for processing data and rendering layers we haven’t even touched yet. With all the events it’s really easy to make things happen at the start, process or end of a map animation which brings loads of possibilities for interaction.
When combining Mapbox GL with React, complex map interactions become well manageable so for the next blogpost I’ll explain how to set up a React based Mapbox web app with some nicely animated markers for the fun of it.
This article was edited by Miquel Cano.


Latest comments (4)
Love this post, Arden! We should talk about what you're ready to work on next ;)
Thanks Erin! I'm working on a fun little sideproject in my free hours which you can find on abroad.arden.nl I'd love to talk a bit more about the steps I'm taking to make it into something nice and shiney :)
Woaaaah I've never seen this pin -> image transition, that's so fresh!
Looks like you're using Vue.js, which we actually haven't blogged about yet. Interesting because there seems to be decent interest:
github.com/phegman/vue-mapbox-gl
github.com/DannyFeliz/vue-mapbox-gl
vuejsexamples.com/a-vue-js-compone...
One you're ready to blog about it, maybe we can get your post up on blog.mapbox.com/ as well for other devs to build on what you've learned.
Cheers, that's all popmotion! Indeed, I've been making versions with both React and Vue, and as I'm working with Vue on a daily basis now I opted to continue my side project with it as well. I haven't been making use of any of those libraries but I'll have a look at them, see if there's something to learn from there, thanks :).
I'd love to have a post published on your blog, that's good motivation to get on with it. Thanks for the nice words, if I've written something worthwhile I'll shoot you a message if you don't mind.