Remove Environment Bottlenecks
We’ve all heard the phrase “time is money” and we intuitively know this statement to be true, but understanding just how much money is spent on labor can be a tricky thing to estimate. This is especially true with complex operations like software development. Before I learned how to write code in React/Node JS, I was an industrial engineer for many years and spent time studying this topic at university.
Industrial engineering is a systems-thinking discipline that is obsessed with figuring out how to optimize resources and improve processes to get the most out of a system. It borrows from other fields like economics, project management, mechanical engineering, and statistics, to name a few, and lies at the intersection between business operations and engineering. Quality, Cost, Schedule, and Safety can all be measured and quantified with incremental improvements made across each category.
These topics can be easy to grapple with when dealing with a consistent, repeatable process like a manufacturing assembly line, hospital queue, or restaurant. However, wrestling with non-standard operations like software development can be nebulous, abstract, and difficult to shove into a one-type-fits-all solution. But that doesn’t mean that we shouldn’t attempt to understand it. Any attempt at understanding and gathering data is still incrementally better than remaining ignorant and relying on gut-intuition alone.
The Problem
As I started to learn how to write software applications a couple years ago, I had high hopes of perhaps crossing my industrial engineering and project management skills into the realm of software. Gradually, as I began to understand the Agile/Scrum approach, I realized it is challenging to estimate computer programming labor resources and it’s not a very good planning approach, especially in a start-up culture.
You don’t have a blueprint, there are no bills of materials, there is no work breakdown structure or sequence of operations. Instead, it’s better to deal with chunks of hazy ranges, like “well, it could take a day or two, but less than a week” and then iterate toward a solution, biting off smaller chunks at a time. Precedence is still knowable in many cases and you can break the problem into smaller pieces, but estimating how long it will take is not really worth figuring out because it doesn’t help you gain any ground toward solving the problem. Time estimation is purely an administrative task that will need to be repeated ad infinitum because no two tickets are ever the same.
Software development can have many unknowns which further complicates any attempts at labor estimation. The ‘Johari Window’ is a method for identifying known or unknown knowledge that a person and their surrounding organization may possess. Some things fall into the ‘known-unknown’ category which means you need to research something that you don’t know yet. But even worse, the ‘unknown-unknown’ realm often crops up, which is to say that you have no idea what is going on until you dive in and start to uncover hidden things.
In software development, especially when trying something new and novel—like in a startup—there are many unknowns. Pioneering into uncharted areas takes an extra amount of time and effort when building a greenfield product, fixing bugs, doing user research, discovering go-to-market fit, and so on. As a company matures, some software development and ticket refinement might approach a stable steady-state, but in many cases, if the company continues to innovate, there will always be many unknowns.
The Solution
So what are we supposed to do? We know that software development labor is costly, and in fact, is often the top operating cost for a tech company. It’s important to investigate and attempt to understand how labor is allocated so we can begin to feel more confident about what we are willing to build or not. There are important decisions that many managers face: should we build something in-house using our own labor resources? Or can we get something off-the-shelf that can be customized to fit our needs? It would also be good to know whether a manager’s most precious resource is blocked with bottlenecks and being under- or over-utilized. Having a rough understanding of your labor resources can help make this type of decision much easier.
One of the best ways to understand a complex system is to model it. We see this all the time when we watch the weather report on the news when the reporter stands in front of a weather map and gives a rough forecast using a computer simulation. Statistical modeling is now used in a variety of complex industries to make planning forecasts with many different input variables.
It’s important to know that a model is just that: a simulation, a mock-up, an imaginary scenario. It’s not real, just ask Morpheus in the Matrix. Every statistical model relies heavily upon baseline assumptions and measured, knowable, controlled inputs that can be adjusted for a range of possible outcomes. The more data you have, the more reliable the model becomes, but it has to start somewhere with a simplified version of reality broken up into discrete events built upon statistical averages.
So what are some of the safe assumptions we can make about a typical tech startup? First, we would want to add boundaries to our system. We can fix the number of employees and their typical working hours. Tickets tend to vary widely, but it is possible to make different ticket types broken down into difficulty levels. Let’s say the easy ones are half a day, while the tougher ones might take a week. We also know the number of environments we have available for testing our code. These might be custom built, maybe there are 2 or 3.
Some other knowable assumptions might be how long it takes to deploy our code to production and whether a certain amount of tickets will need rework after QA testing, let’s say 25%. It’s rather arbitrary, but in the absence of solid data, we can plug in some intuitive anecdotal numbers to start with. If you hold all things consistent, but only adjust one variable at a time, then you can begin to compare the results to uncover any major bottlenecks in the system. Models are a simplified version of reality, so we start really simply. To use a crude example, we could simulate 5 farmers working 8 hrs/day in a 500 acre field using 3 tractors, record what happens, then run it again with only 2 tractors instead for comparison.
Simulation Results
In this blog post, we will share the end results of our analysis. For a full detail of the simulation setup and results, you can download our free whitepaper.
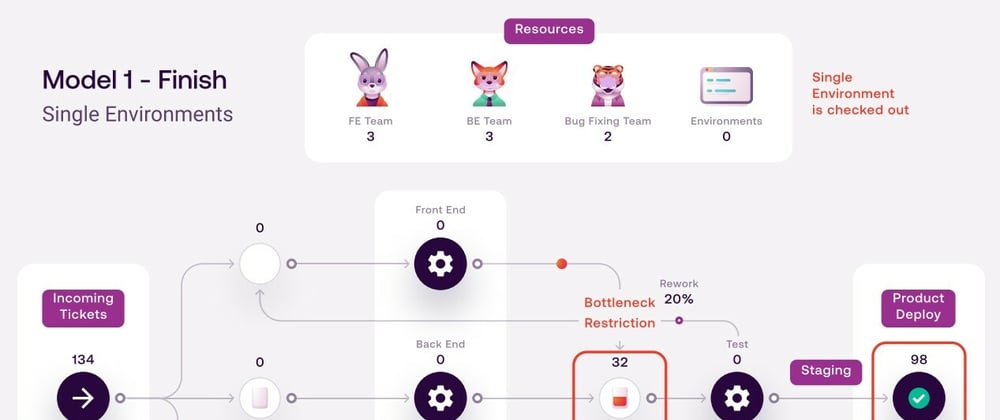
Key takeaway: If we increase the number of available environments to 5 while keeping all other variables consistent, we saw the simulated throughput went up to 132 tickets, a 35% increase.
After running the baseline setup with only a single staging environment, we can see the team can complete 98 tickets, but more importantly, we can identify a major bottleneck as 32 tickets are piled up waiting for a test environment resource. If we increase the number of available environments to 5 while keeping all other variables consistent, we saw the simulated throughput went up to 132 tickets, a 35% increase. The bottleneck has also been eliminated and there are even a few surplus environments available.
Again, to read the full results and analysis, be sure to download the free whitepaper.


Top comments (0)