If you liked what you read feel free to connect with me on linkedin or follow me on dev.to :)
Today is going to be another quick tutorial on how you can display a chart on an adaptive card for a chat bot. It's a fairly straight forward, I had wanted to do this for my series on creating a Twitter sentiment analysis chatbot but couldn't find anything on it until now.
You can see the code in the repo linked below:
Now on to the coding.
Introduction
Like with most things programming related there are many ways of achieving this but, they all involve generating an image of a chart and using that in the AdaptiveImage element to display the image. The easiest way that I have found is to use a third party API to generate the chart and send it back via a get request.
Here is a link to the documents for the API: https://documentation.image-charts.com/
And here is the URL that we can use to generate the graph:
https://image-charts.com/chart?cht=p3&chs=300x300&chd=t:{0}&chl={1}&chan
The API is exactly what I need for it more-over it's free :).
Below is a snipping of the code that I used to add a chart to the adaptive card for the Twitter sentiment analysis bot.
        AdaptiveImage GetStatisticsChart(Dictionary<string, int> tweetSentimentAnalysis, int numberOfTweetsFound)
        {
            return new AdaptiveImage
            {
                Size = AdaptiveImageSize.Large,
                Url = GetPieChartUrl(tweetSentimentAnalysis, numberOfTweetsFound)
            };
        }

        Uri GetPieChartUrl(Dictionary<string, int> tweetSentimentAnalysis, int numberOfTweetsFound)
        {
            string seriesNames = string.Join('|', tweetSentimentAnalysis.Keys);
            string percentages = string.Empty;

            foreach (var val in tweetSentimentAnalysis.Values)
            {
                percentages += $"{Math.Round(((float)val * 100) / numberOfTweetsFound)},";
            }

            percentages = percentages.Remove(percentages.Length - 1);

            return new Uri(string.Format(baseUrl, percentages, seriesNames));
        }
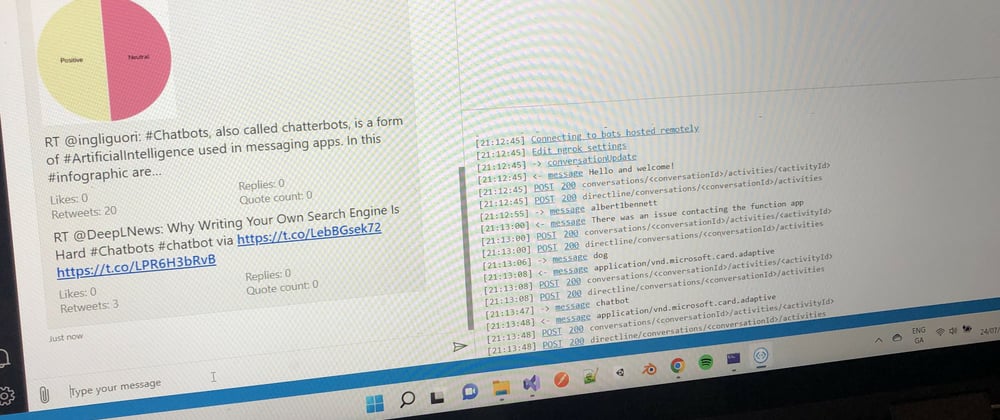
The important part of the above is the that the URL of the AdaptiveImage is set to the URI of the API endpoint with the specifics to generate your graph. The query parameters that I interpolated were the series and what percentage of the pie chart was covered by it. In my example and as shown in the image below there are two series separated in the URL by a '|' each with a value of 50 separated by ','. According to the docs on the API the colors of each series can be defined as well but, I chose not to as it is a little more complex than just setting the hex codes for the series.

The other thing to note and you can see that when you go through the docs is that you can also change the type of chart to generate in my example I chose to generate a pie chart as it presented the data better.
Other solutions
The only other method for generating an image of a pie chart for an Adaptive card that I could think of is to do it yourself. You could create a web app in Visual Studios or use an existing one or whatever you like to use. Then using the graphics object generate the chart by using the query parameters or header values from a request to one of the apps controller. From there you could... just return the image. Alternatively you could save an image of the graph to blob storage in Azure or another cloud provider after generating the image and the integrate with that to get back the chart that you are after.
Here is a link to the original series of posts on the Twitter sentiment analysis chatbot if you are interested:
Thanks for reading and I'll see you in the next one.


Latest comments (0)