A custom IOT stack running on a Raspberry Pi is an effective way to start with adding and reading sensor data or the entry to home automation. The first article in this series showed how to install a complete stack of IOT software, namely MQTT for receiving, NodeRed for transforming, and InfluxDB for storing IOT sensor data. In addition, an optional installation of OpenMedia Vault turns the Raspberry Pi into a SAMBA/NFS share. The basics of the stack are ready, and now we can add additional sensors and software step-by-step.
This article shows how to install Telegraf, a software for gathering, processing and sending hardware or sensor data. Telegraf is used to collect essential hardware metrics from the Raspberry Pi, such as its memory usage, disk usage and temperature. The installation happens as a Docker container that is configured with Docker Compose.
The technical context of this article is Raspberry Pi Os 2021-05-07 and Telegraf 1.18.3. All instructions should work with newer versions as well.
This article originally appeared at my blog admantium.com.
Install Telegraf
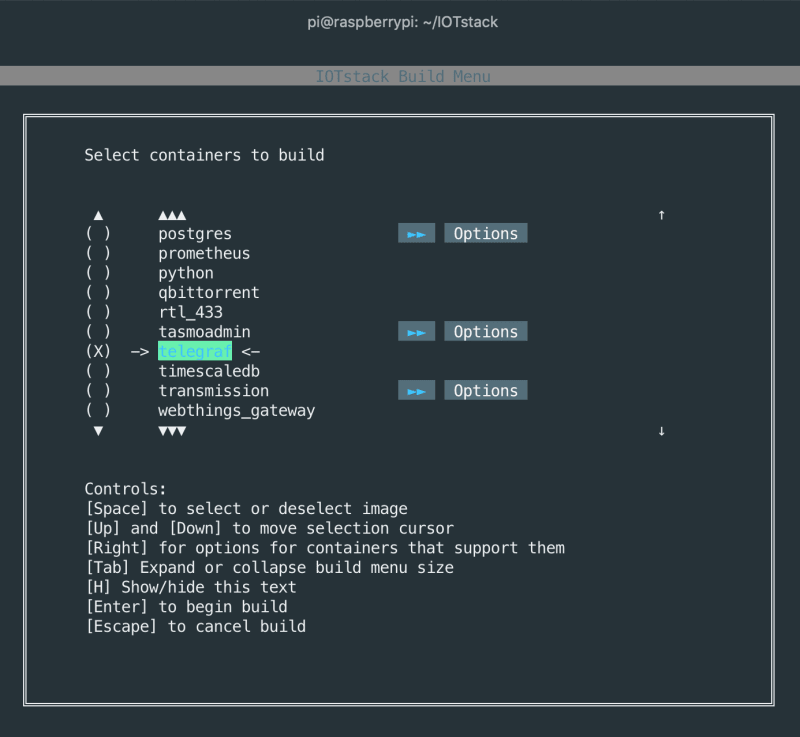
We add Telegraf with the IOT stack menu by executing menu.sh, then choosing Build Stack and scrolling down to Telegraf.
This results in the following docker-compose.yml config:
telegraf:
    container_name: telegraf
    image: telegraf
    restart: unless-stopped
    volumes:
      - ./services/telegraf/telegraf.conf:/etc/telegraf/telegraf.conf:ro
    privileged: true
    depends_on:
    - influxdb
    - mosquitto
    networks:
    - iotstack_nw
As we see, IOT stack takes care to mount all required directories and proc files, and it provides us with an initial configuration file telegraf.conf that already includes the setup for communicating with InfluxDB and Mosquito in the same docker network. Perfect!
# Configuration for sending metrics to InfluxDB
[[outputs.influxdb]]
urls = ["http://influxdb:8086"]
database = "telegraf"
exclude_database_tag = false
skip_database_creation = false
retention_policy = ""

# Read metrics from MQTT topic(s)
[[inputs.mqtt_consumer]]
servers = ["tcp://mosquitto:1883"]
topics = [
"telegraf/host01/cpu",
"telegraf/+/mem",
"sensors/#",
]
In order that Telegraf can get metrics from the host, we need to configure additional properties in the ~/IOTstack/docker-compose.yml file following this github thread.
telegraf:
    container_name: telegraf
    image: telegraf
    restart: unless-stopped
    environment:
      HOSTNAME: "raspberrypi"
      HOST_ETC: "/hostfs/etc"
      HOST_PROC: "/hostfs/proc"
      HOST_SYS: "/hostfs/sys"
      HOST_MOUNT_PREFIX: "/hostfs"
    volumes:
      - /:/hostfs:ro
      - /etc:/hostfs/etc:ro
      - /proc:/hostfs/proc:ro
      - /sys:/hostfs/sys:ro
      - /var/run/utmp:/var/run/utmp:ro
      - ./services/telegraf/telegraf.conf:/etc/telegraf/telegraf.conf:ro
    privileged: true
    depends_on:
    - influxdb
    - mosquitto
    networks:
    - iotstack_nw
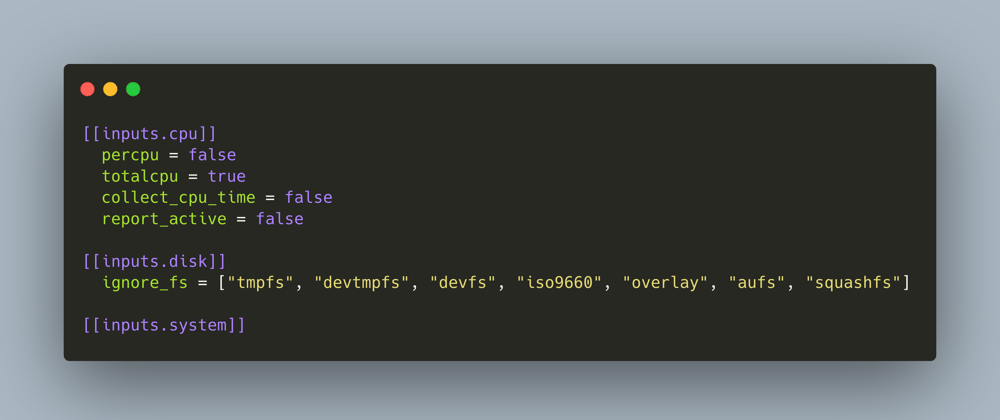
And also, we need to add the metrics that we are interested in. In Telegraf’s language, these are inputs - see the complete input list for all available options. As an example, lets scrape system, disk and CPU stats. Add the following to Telegraf's config file:
[[inputs.cpu]]
  ## Whether to report per-cpu stats or not
  percpu = false
  ## Whether to report total system cpu stats or not
  totalcpu = true
  ## If true, collect raw CPU time metrics
  collect_cpu_time = false
  ## If true, compute and report the sum of all non-idle CPU states
  report_active = false

[[inputs.disk]]
  ## By default stats will be gathered for all mount points.
  ## Set mount_points will restrict the stats to only the specified mount points.
  # mount_points = ["/"]

  ## Ignore mount points by filesystem type.
  ignore_fs = ["tmpfs", "devtmpfs", "devfs", "iso9660", "overlay", "aufs", "squashfs"]

[[inputs.system]]
Stop and start the stack. Then, let’s check what Telegraf would scrape.
> docker run telegraf telegraf -test
2021-08-25T15:13:34Z I! Starting Telegraf 1.19.3
2021-08-25T15:13:34Z I! Using config file: /etc/telegraf/telegraf.conf
2021-08-25T15:13:34Z I! [inputs.mqtt_consumer] Connected [tcp://mosquitto:1883]

> system,host=149d0f0d1652 load1=3.67,load15=0.77,load5=1.46,n_cpus=4i,n_users=4i 1629904415000000000
> system,host=149d0f0d1652 uptime=104966i 1629904415000000000
> system,host=149d0f0d1652 uptime_format="1 day, 5:09" 1629904415000000000
> disk,device=sda2,fstype=ext4,host=149d0f0d1652,mode=ro,path=/ free=118755082240i,inodes_free=7818668i,inodes_total=8096000i,inodes_used=277332i,total=132069298176i,used=7919448064i,used_percent=6.251807719353295 1629904415000000000
> disk,device=sda1,fstype=vfat,host=149d0f0d1652,mode=rw,path=/boot free=212980736i,inodes_free=0i,inodes_total=0i,inodes_used=0i,total=264289280i,used=51308544i,used_percent=19.41378174703113 1629904415000000000
> disk,device=sda2,fstype=ext4,host=149d0f0d1652,mode=rw,path=/var/folder2ram/var/log free=118755082240i,inodes_free=7818668i,inodes_total=8096000i,inodes_used=277332i,total=132069298176i,used=7919448064i,used_percent=6.251807719353295 1629904415000000000
> disk,device=sda2,fstype=ext4,host=149d0f0d1652,mode=rw,path=/var/folder2ram/var/tmp free=118755082240i,inodes_free=7818668i,inodes_total=8096000i,inodes_used=277332i,total=132069298176i,used=7919448064i,used_percent=6.251807719353295 1629904415000000000
> disk,device=sda2,fstype=ext4,host=149d0f0d1652,mode=rw,path=/var/folder2ram/var/lib/openmediavault/rrd free=118755082240i,inodes_free=7818668i,inodes_total=8096000i,inodes_used=277332i,total=132069298176i,used=7919448064i,used_percent=6.251807719353295 1629904415000000000
> disk,device=sda2,fstype=ext4,host=149d0f0d1652,mode=rw,path=/var/folder2ram/var/spool free=118755082240i,inodes_free=7818668i,inodes_total=8096000i,inodes_used=277332i,total=132069298176i,used=7919448064i,used_percent=6.251807719353295 1629904415000000000
> disk,device=sda2,fstype=ext4,host=149d0f0d1652,mode=rw,path=/var/folder2ram/var/lib/rrdcached free=118755082240i,inodes_free=7818668i,inodes_total=8096000i,inodes_used=277332i,total=132069298176i,used=7919448064i,used_percent=6.251807719353295 1629904415000000000
> disk,device=sda2,fstype=ext4,host=149d0f0d1652,mode=rw,path=/var/folder2ram/var/lib/monit free=118755082240i,inodes_free=7818668i,inodes_total=8096000i,inodes_used=277332i,total=132069298176i,used=7919448064i,used_percent=6.251807719353295 1629904415000000000
> disk,device=sda2,fstype=ext4,host=149d0f0d1652,mode=rw,path=/var/folder2ram/var/cache/samba free=118755082240i,inodes_free=7818668i,inodes_total=8096000i,inodes_used=277332i,total=132069298176i,used=7919448064i,used_percent=6.251807719353295 1629904415000000000
> disk,device=sda3,fstype=ext4,host=149d0f0d1652,mode=rw,path=/srv/dev-disk-by-uuid-c6cb3276-16dd-4377-81c5-c03a59b9280c free=319743139840i,inodes_free=22317551i,inodes_total=22323200i,inodes_used=5649i,total=358805073920i,used=20764282880i,used_percent=6.098041186336932 1629904415000000000
> disk,device=sda3,fstype=ext4,host=149d0f0d1652,mode=rw,path=/export/share free=319743139840i,inodes_free=22317551i,inodes_total=22323200i,inodes_used=5649i,total=358805073920i,used=20764282880i,used_percent=6.098041186336932 1629904415000000000
> disk,device=sda2,fstype=ext4,host=149d0f0d1652,mode=ro,path=/etc free=118755082240i,inodes_free=7818668i,inodes_total=8096000i,inodes_used=277332i,total=132069298176i,used=7919448064i,used_percent=6.251807719353295 1629904415000000000
> disk,device=sda2,fstype=ext4,host=149d0f0d1652,mode=rw,path=/etc/resolv.conf free=118755082240i,inodes_free=7818668i,inodes_total=8096000i,inodes_used=277332i,total=132069298176i,used=7919448064i,used_percent=6.251807719353295 1629904415000000000
> disk,device=sda2,fstype=ext4,host=149d0f0d1652,mode=rw,path=/etc/hostname free=118755082240i,inodes_free=7818668i,inodes_total=8096000i,inodes_used=277332i,total=132069298176i,used=7919448064i,used_percent=6.251807719353295 1629904415000000000
> disk,device=sda2,fstype=ext4,host=149d0f0d1652,mode=rw,path=/etc/hosts free=118755082240i,inodes_free=7818668i,inodes_total=8096000i,inodes_used=277332i,total=132069298176i,used=7919448064i,used_percent=6.251807719353295 1629904415000000000
> disk,device=sda2,fstype=ext4,host=149d0f0d1652,mode=ro,path=/etc/telegraf/telegraf.conf free=118755082240i,inodes_free=7818668i,inodes_total=8096000i,inodes_used=277332i,total=132069298176i,used=7919448064i,used_percent=6.251807719353295 1629904415000000000
> cpu,cpu=cpu-total,host=149d0f0d1652 usage_guest=0,usage_guest_nice=0,usage_idle=98.99999999909778,usage_iowait=0,usage_irq=0,usage_nice=0,usage_softirq=0,usage_steal=0,usage_system=0.499999999996362,usage_user=0.499999999996362 1629904415000000000
This looks good. Now we check wether this data arrives in influxdb. Also read the essential InfluxDB commands.
docker exec -it influxdb bash
root@a2f105167420:/# ls
bin dev etc init-influxdb.sh media opt root sbin sys usr
boot entrypoint.sh home lib mnt proc run srv tmp var
root@a2f105167420:/# influx
Connected to http://localhost:8086 version 1.8.9
InfluxDB shell version: 1.8.9

> use telegraf
> Using database telegraf
> show measurements
> name: measurements

## name

cpu
disk
system

> show field keys from cpu
> name: cpu
> fieldKey fieldType

---

usage_guest float
usage_guest_nice float
usage_idle float
usage_iowait float
usage_irq float
usage_nice float
usage_softirq float
usage_steal float
usage_system float
usage_user float
Excellent! Data is being recorded. Now, let’s head to the final part and create a Grafana dashboard.
Be sure to have the correct data source in your InfluxDB configured.
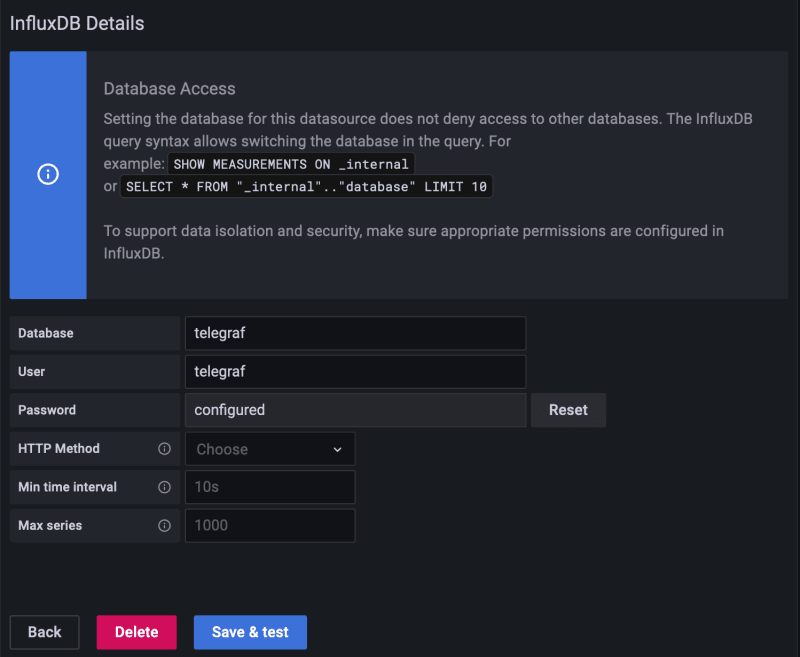
My initial dashboard is very plain: Just showing all the available data. I used these queries:
select * from cpu
select * from system
select * from disk
After some adjustments, the dashboard now looks as this:

Optimization of Raspberry Pi Resources and Limit Power Consumption
_Note: All of the following steps work with Raspberry Pi OS 2021-05-07. Things might have changed, be sure to re-check with the official documentation.
To further optimize your stack, here are additional steps that you can apply:
- Disable Desktop Booting: Run
raspi-config, then select1 System OptionsandS5 Boot / Auto Login. - Limit GP Memeory to 16B: Run
raspi-config, then select4 Performance OptionsandP2 GPU Memory, reduce this to16B - Disable HDMI: Edit
/etc/rc.localto add the following line at the file end.
  /usr/bin/tvservice -o
  exit 0
- Disable Bluetooth: First, execute
sudo systemctl disable hciuartandsudo systemctl disable bluetooth.serviceonce. Then, edit/boot/config.txt, and add the following text to this files end:
dtoverlay=disable-bt
- Disable Onboard LED: Finally, you can also disable the red power led and the green status led. Insert this into
/boot/config.txt:
  dtparam=pwr_led_trigger=none
  dtparam=pwr_led_activelow=off

  dtparam=act_led_trigger=none
  dtparam=act_led_activelow=off
Apply these settings with care. If, after a reboot, your Raspberry Pi is not accessible via SSH anymore, you will need to connect change the boot settings to first get HDMI back and then start debugging from thereon. It happened to me - so be warned.
Conclusion
Telegraf is a versatile tool in any IOT project. This article showed how to setup Telegraf as a Docker container inside the IOTStack. With a simple configuration in the docker-compose.yml file that give additional access rights to your host, you can start to get meaningful metrics in minutes. But Telegraf is more than that: It also provides processor and aggregator plugins, and it can output the metrics to many other sources as well. How will you use Telegraf?


Oldest comments (0)