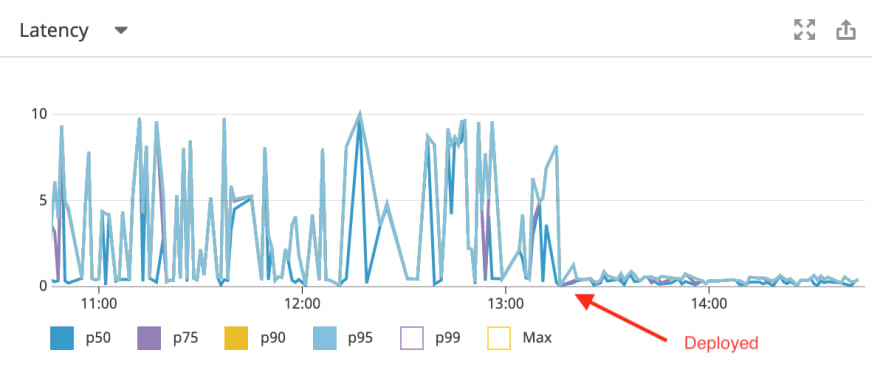
It recently came to my attention that one of our API endpoints was hogging a lot of resources and taking over 3 seconds to complete per request. I was able to cut average memory usage from 85mb to 7mb and average request duration from 3000ms to 150ms. I'm going to detail that process in this post.
Let's get started by installing the tools we're going to use.
Set up bullet
bullet is a gem that helps you identify and correct N+1 queries.
We'll add this to our Gemfile:
group :development do
  gem 'bullet'
end
And this to our config/application.rb:
  config.after_initialize do
    Bullet.enable = true
    Bullet.rails_logger = true
  end
Set up rack-mini-profiler
rack-mini-profiler is a middleware that provides database and memory profiling. Let's get that set up so we can get a closer look into what's causing our issues.
We need to add rack-mini-profiler and memory_profiler to our Gemfile below the database gem, and run bundle to install it.
gem 'pg'
gem 'rack-mini-profiler'
gem 'memory_profiler'
Next, we'll add this to config/initializers/mini_profiler.rb:
Rack::MiniProfiler.config.authorization_mode = :allow_all
When rack-mini-profiler is enabled, it saves the profiler output from previous requests and injects a badge into the next HTML page that is loaded. But we're in an API only app, so in order to see the badge, we're going to have to serve an HTML page.
Note: If you're planning on checking this code into your repo, you'll want to add some sort of authorization around authorize_request.
Here's my PerformanceTestsController:
class PerformanceTestsController < ActionController::Base
  before_action do
    Rack::MiniProfiler.authorize_request
  end

  def index
  end
end
app/views/performance_tests/index.html:
<body></body>
config/routes.rb:
get '/performance_tests', to: 'performance_tests#index'
Once you have that set up, if you open /performance_tests in your browser, you should be seeing this badge in the top left.

Recreate the environment
When you're investigating a production performance problem, you want the environment you test in to be as similar to the production environment as possible. In Rails' development mode, class caching is disabled, so the time it takes to complete requests can vary wildly. I ran these tests in production mode on my local machine with a similar dataset to the one found in the prod db.
Isolate
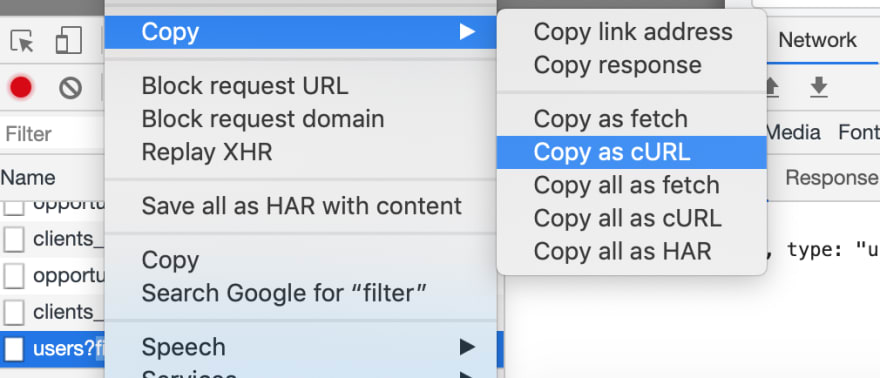
We use Ember as our front end framework, which can make several calls to the API on page load. I wanted to isolate the problematic API call so I could repeat it as quickly as possible as many times as necessary. The endpoint requires an authentication header, so I just used Chrome's Copy as cURL function to grab everything I needed in one command.
Benchmark
Now that we have our environment and tools set up, it's time to get our hands dirty and try to figure out what's actually going on. The endpoint in question is UsersController#index:
def index
  users = User.joins(:roles).where(roles: { title: params[:roles] })

  respond_with users, include: %w[roles groups]
end
Before we start making changes, the first thing we're going to want to do is to get a benchmark control with the code in its current state. That way we can ensure the changes we're going to make are actually improvements.
rack-mini-profiler has several options available to pass in through the pp= query parameter, but the two we're going to be using are pp=profile-memory and pp=enable.
The first request always seems to have higher resource usage than subsequent requests, so I always fire the request twice and take the benchmarks from the second request.
Here we go, let's get our memory control:
# All Users (`/users?pp=profile-memory`)
Total allocated: 60047355 bytes (744989 objects)
Total retained:  1356020 bytes (8851 objects)
In addition to memory usage, we're going to want to check the rack-mini-profiler badge that displays info on response timings and SQL queries. We do this by using the pp=enable query parameter then opening /performance_tests as described in the rack-mini-profiler setup section above.
# All Users (`/users?pp=enable`)
Total Duration: 7795ms
SQL Duration: 373ms
SQL Queries: 1139
😱
This is bad! Let's fix it.
Eliminating N+1 queries
The amount of SQL queries being executed per request suggests that we've got some N+1 issues going on, so let's take a look at that first. We'll make one change and then run the benchmarks again.
Let's change the joins(:roles) to includes(:roles, :groups) so our roles and groups will be eager loaded.
def index
  users = User.includes(:roles, :groups).where(roles: { title: params[:roles] })

  respond_with users, include: %w[roles groups]
end
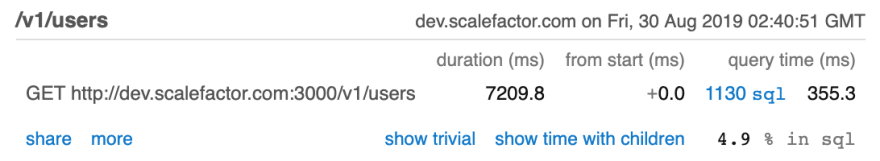
Here are the benchmarks with includes:
Total allocated: 436705757 bytes (4119179 objects)
Total retained:  4646110 bytes (33480 objects)

Total Duration: 7209ms
SQL Duration: 355ms
SQL Queries: 1130
Eager loading all of those roles actually caused the memory usage to increase 7x! The duration and queries decreased a bit, but this is obviously not the fix we were hoping for.
Let's use the rack-mini-profiler HTML badge to see the queries that are being executed.
When I expanded the 1130 sql link, I saw a lot of entries similar to this:
app/serializers/user_serializer.rb:72:in `employee_id'
app/controllers/v1/users_controller.rb:53:in `index'
app/controllers/application_controller.rb:48:in `set_current_attrs'
SELECT  "employees".* FROM "employees" WHERE "employees"."user_id" = $1 LIMIT $2;
At this point, I think the issue lies mainly within the serializer, so let's take a look at what's going on in there.
class UserSerializer < ActiveModel::Serializer
  attributes :id,
             :email,
             :first_name,
             :last_name,
             :last_login_at,
             :employee_id

  has_one :employee
  has_many :assignments
  has_many :direct_roles
  has_many :roles, through: :assignments
  has_many :group_assignments
  has_many :groups, through: :group_assignments

  def employee_id
    object.employee&.id
  end
end
Now we're on to something! Every time a User object is serialized, we're issuing queries for each of the associations listed here. We can try to eager load each of these associations with includes, but what if we don't need these associations for the index action at all?
Real quick, let's check out the show action next to index in UsersController.
  def index
    users = User.includes(:roles, :groups).where(roles: { title: params[:roles] })

    respond_with users, include: %w[roles groups]
  end

  def show
    respond_with @user, include: %i[roles roles_tags assignments groups group_assignments groups.roles]
  end
show is serialized via the same UserSerializer class. It's starting to look like those associations were added to the serializer so they would be included on the show endpoint.
For now, I'm only making optimizations to index, so show and any other actions using UserSerializer need to be unaffected. I think the path forward is to create an index-specific serializer with a sparse fieldset -- we'll include only the data we need in the response.
# app/controllers/users_controller.rb
def index
  users = User.includes(:roles, :groups).where(roles: { title: params[:roles] })

  respond_with users, include: [:roles, :groups], each_serializer: Users::Index::UserSerializer
end

# app/serializers/users/index/user_serializer.rb
class Users::Index::UserSerializer < ActiveModel::Serializer
  attributes :id,
             :email,
             :first_name,
             :last_name,
             :last_login_at,
             :employee_id

  has_many :roles, through: :assignments
  has_many :groups, through: :group_assignments

  def employee_id
    object.employee&.id
  end
end
I removed all associations except the ones we want to side load, roles and groups. Let's check our numbers.
Total allocated: 242932074 bytes (2392253 objects)
Total retained:  2511484 bytes (18008 objects)

Total Duration: 3650ms
SQL Duration: 202ms
SQL Queries: 571
Our first big improvement! At this point, I checked where this endpoint was being called in our frontend apps and verified that we didn't need the associations that were removed.
But, 571 queries. Let's check the Bullet output to the Rails log to see if it's identified any N+1 queries.
USE eager loading detected
  User => [:employee]
  Add to your finder: :includes => [:employee]
Call stack
  /Users/mculp/sf/cs/app/serializers/users/index/user_serializer.rb:66:in `employee_id'

USE eager loading detected
  User => [:group_assignments]
  Add to your finder: :includes => [:group_assignments]
Call stack
  /Users/mculp/sf/cs/app/models/user.rb:229:in `roles'

USE eager loading detected
  User => [:assignments]
  Add to your finder: :includes => [:assignments]
Call stack
  /Users/mculp/sf/cs/app/controllers/v1/users_controller.rb:49:in `index'
Yep! Let's eager load employee, group_assignments, and assignments.
  def index
    users = User
              .includes(:roles, :groups, :employee, :group_assignments, :assignments)
              .where(roles: { title: params[:roles] })

    respond_with users, each_serializer: Users::Index::UserSerializer, include: [:roles, :groups]
  end
Numbers:
Total allocated: 80137296 bytes (825840 objects)
Total retained:  761444 bytes (5371 objects)

Total Duration: 1580ms
SQL Duration: 58ms
SQL Queries: 124
Another big improvement. Bullet is no longer screaming at us in the Rails log.
After checking rack-mini-profiler, I see that we still have an N+1:
app/models/user.rb:476:in `last_login_at'
app/controllers/v1/users_controller.rb:49:in `index'
app/controllers/application_controller.rb:48:in `set_current_attrs'
SELECT  "authentication_tokens".* FROM "authentication_tokens" WHERE "authentication_tokens"."user_id" = $1 AND "authentication_tokens"."on_behalf" = $2 ORDER BY "authentication_tokens"."id" DESC LIMIT $3;
Here's the code for last_login_at:
  def last_login_at
    token = authentication_tokens.where(on_behalf: false).last
    token&.last_used_at
  end
This one is trickier to fix. We can't simply eager load authentication_tokens because this method is issuing a query each time it's called.
However, what we can do is create a new scoped association and eager load it.
  # app/models/user.rb
  has_one :last_login_authentication_token,
    -> { where(on_behalf: false) },
    class_name: 'AuthenticationToken'

  def last_login_at
    last_login_authentication_token&.last_used_at
  end
  # app/controllers/users_controller.rb
  def index
    eager_load_associations = [
      :roles, :groups, :employee, :group_assignments,
      :assignments, :last_login_authentication_token
    ]

    users = User.includes(eager_load_associations).where(roles: { title: params[:roles] })

    respond_with users, each_serializer: Users::Index::UserSerializer, include: [:roles, :groups]
  end
This should take care of our last N+1 issue. Let's make sure:
Total allocated: 69663419 bytes (872929 objects)
Total retained:  302956 bytes (1818 objects)

Total Duration: 1250ms
SQL Duration: 26ms
SQL Queries: 12
It's looking good from a SQL standpoint! The rest of the time is being spent instantiating and serializing objects.
Let's take a look at what we can do to make some improvements on that front.
Further Optimizations
fast_jsonapi
fast_jsonapi is a gem by the engineering team at Netflix that promises 25x faster serialization than ActiveModel::Serializers.
We want to ensure that with every change on this library, serialization time is at least 25 times faster than Active Model Serializers on up to current benchmark of 1000 records.
That sounds too good to be true, but it can't hurt to try it!
  # app/controllers/users_controller.rb
  def index
    eager_load_associations = [
      :roles, :groups, :employee, :group_assignments,
      :assignments, :last_login_authentication_token
    ]

    users = User.includes(eager_load_associations).where(roles: { title: params[:roles] })

    respond_with users,
      each_serializer: Fast::Users::Index::UserSerializer,
      include: [:roles, :groups]
  end
# app/serializers/fast/users/index/user_serializer.rb
class Fast::Users::Index::UserSerializer
  include FastJsonapi::ObjectSerializer

  attributes :id,
             :email,
             :first_name,
             :last_name,
             :employee_id,
             :last_login_at

  has_many :roles, through: :assignments, serializer: Fast::Users::Index::RoleSerializer
  has_many :groups, through: :group_assignments, serializer: Fast::Users::Index::GroupSerializer

  attribute :employee_id do |object|
    object.employee&.id
  end
end
# app/serializers/fast/users/index/role_serializer.rb
class Fast::Users::Index::RoleSerializer
  include FastJsonapi::ObjectSerializer

  attributes :id, :title, :description
end
# app/serializers/fast/users/index/group_serializer.rb
class Fast::Users::Index::GroupSerializer
  include FastJsonapi::ObjectSerializer

  attributes :title, :description, :archived
end
Numbers:
Total allocated: 54130985 bytes (698850 objects)
Total retained:  189166 bytes (935 objects)

Total Duration: 707ms
SQL Duration: 21ms
SQL Queries: 6
Well, it's not 25x, but that's still a pretty impressive improvement. We're gonna roll with it.
Caching
fast_jsonapi also has built in object caching, which uses Rails' cache_key under the hood to do cache invalidation. I think it'd work well for our use case here, so let's try it.
We're using Redis as the cache store, which was set up in config/environments/production.rb:
  if ENV['REDIS_URL']
    config.cache_store = :redis_store, ENV['REDIS_URL'], { expires_in: 12.hours }
  end
Now all we have to do is add this cache_options line to our serializer to cache each User object:
# app/serializers/fast/users/index/user_serializer.rb
class Fast::Users::Index::UserSerializer
  include FastJsonapi::ObjectSerializer

  cache_options enabled: true, cache_length: 12.hours

  attributes :id,
             :email,
             :first_name,
             :last_name,
             :employee_id,
             :last_login_at

  has_many :roles, through: :assignments, serializer: Fast::Users::Index::RoleSerializer
  has_many :groups, through: :group_assignments, serializer: Fast::Users::Index::GroupSerializer

  attribute :employee_id do |object|
    object.employee&.id
  end
end
Now, let's run the numbers.
Total allocated: 10239567 bytes (92500 objects)
Total retained:  413751 bytes (2609 objects)

Total Duration: 165ms
SQL Duration: 17ms
SQL Queries: 6
🥳🎉


Top comments (5)
This is awesome! Both the benchmarking setup as well as the actual optimizations.
Matt,
Love the post! We've got an almost identical setup for Rails API.
Do you use the JSON API standard in your responses? We don't (its kinda bloated), so that's holding us back from moving from AMS to Fast JSON API. I'd like to use Fast JSON, since it is consistent and we end up writing custom serializers (pluck -> hashes -> raw json) whenever perf matters.
Thanks!
We do use JSON:API. I think one of the biggest advantages of using it is exactly what you mentioned: there's a pretty nice ecosystem of tools that you can easily switch between.
I do agree that it can get bloated, especially when
includeis used wildly. But compound docs can also reduce the number of requests made to the server, so it can go both ways.Matt
Your post is symple amazing. Easy to undestand and implement.
Thank YouTube for sharing your knowledge with us.
Thank you, I'm glad you liked it!